It started with a single cron job, then grew to a dozen, across different schedules, servers, and parameters, with no reliable way to verify whether any of them were working. This is a common trigger for adopting a pipeline orchestrator, and it’s what led us to evaluate one while building 7Seers, our AI-powered employability platform for engineering and management colleges.
Struggling with the same brittle cron jobs and silent failures? 47Billion’s Data Analytics team helps engineering teams design and migrate to modern orchestration layers like Dagster. Talk to our data engineers.
Where It Started
As 7Seers’ microservices grew, our background job setup started with one cron job to scrape job listings. Then came job expiry, marking listings stale every two to three days. Then credit expiry, monthly. Then nudge jobs for user notifications. And the scraper itself multiplied, different locations, different titles, each on its own schedule.
Before long, we had four job categories in production, each running multiple times with different configs. The cron table became unmanageable.
Then We Moved to Celery Beat
We moved to Celery with Beat Scheduler, a distributed task queue with scheduling built on top.
The problem: Celery is built for per-record, event-driven tasks. Process this document. Send this email. One record in, one result out. Our jobs didn’t look like that. Scraping wasn’t processing one listing, it was fetching thousands in bulk, through multiple stages. Credit expiry wasn’t reacting to events, it was scanning all users on a schedule.
When something went wrong, we had no visibility: no run history, no alerts, no way to know if a job had completed or silently failed. We only found out once a downstream effect surfaced.
Three problems, repeating:
• No visibility – no single view of what’s running or what it produced
• No alerting – failures silent until something broke downstream
• No recovery – mid-pipeline failure meant re-running everything
Worth being precise here: Dagster and Celery aren’t strictly either/or. Dagster ships its own dagster-celery executor, so you can run Celery underneath Dagster for distributed step execution. We didn’t go that route, we wanted Celery out of the critical path entirely, but it’s a legitimate setup if you just need more parallelism and already like Dagster’s scheduling and visibility layer.
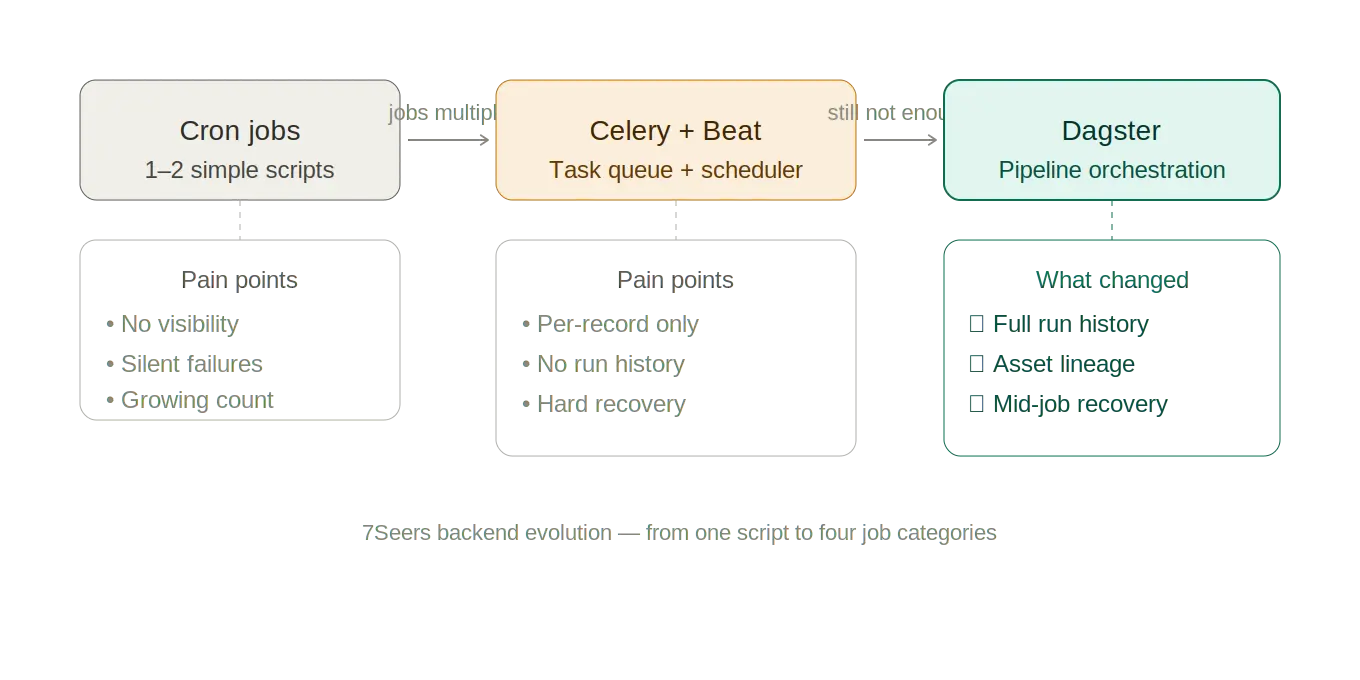
Figure 1: The journey from cron jobs → Celery Beat → Dagster
Looking at the Other Options
Apache Airflow has the biggest ecosystem of the three and is genuinely battle-tested, but it’s heavy for a team starting fresh. DAGs are plain Python, not YAML like people assume, though the scheduling config, retries, and connections still end up scattered across Python files, Airflow’s metadata database, and environment variables. Running the scheduler, webserver, and workers as separate pieces is really what slows a new team down, not the language.
Prefect is Python-native and easy to start, and has changed significantly since we first evaluated it. Back then it had no real way to tell you what a run produced, only that it ran. Prefect has since added an @materialize decorator for asset lineage, which closes some of that gap. But when we were evaluating tools, Dagster already had the asset model built in from the ground up instead of added onto a task-first design. That was the deciding factor.
Dagster solved both, out of the box.
Update, since we first wrote this: In July 2026, Prefect announced it is acquiring Dagster Labs. Both keep running independently under their own names, licenses, and pricing, so nothing here changes if you’re already using either one. Still worth knowing, since it says something about where this market’s headed.
What Dagster Actually Does
Dagster’s core design principle: a pipeline should produce something inspectable, traceable, and trustworthy, not just run. The framework has changed since its early releases. It started as ops wired into graphs, and has moved toward software-defined assets as the primary abstraction. Both terms still appear in the docs and in production code, so both are worth knowing.
Ops: the actual Python functions doing the work, fetching, deduplicating, classifying. Every asset is backed by one or more ops under the hood. Functionally similar to Celery tasks, but designed to chain into a graph.
Jobs: what actually runs and gets monitored, a slice of your op or asset graph. Our scraping job goes raw scrape, deduplicate, classify, post to DB. Each step feeds off the last one’s output, and if one fails, nothing after it runs.
Assets: the named, tracked output a pipeline is responsible for, a table, a Parquet file, a trained model. Most people writing Dagster today start with assets: you say what the asset is and how to build it, and Dagster figures out the order to run things in. The dashboard tells you what the last run of each asset actually produced, when, and how many records came out.
Schedules: live in the same Python file as the job itself. No separate cron table, nothing extra to maintain.
Sensors / webhooks: trigger pipelines off events instead of time. A new file landing in a bucket or an external webhook can kick off a run.
Declarative Automation: the newer way to automate materializations, on top of schedules and sensors. Instead of a cron string, you write a condition, on_cron(), any_deps_updated(), or a mix, and Dagster re-evaluates it roughly every 30 seconds and only runs what actually needs to run. It replaced the older AutoMaterializePolicy API, which is now deprecated. We haven’t moved everything over to it yet, but it’s the direction new Dagster code is heading.
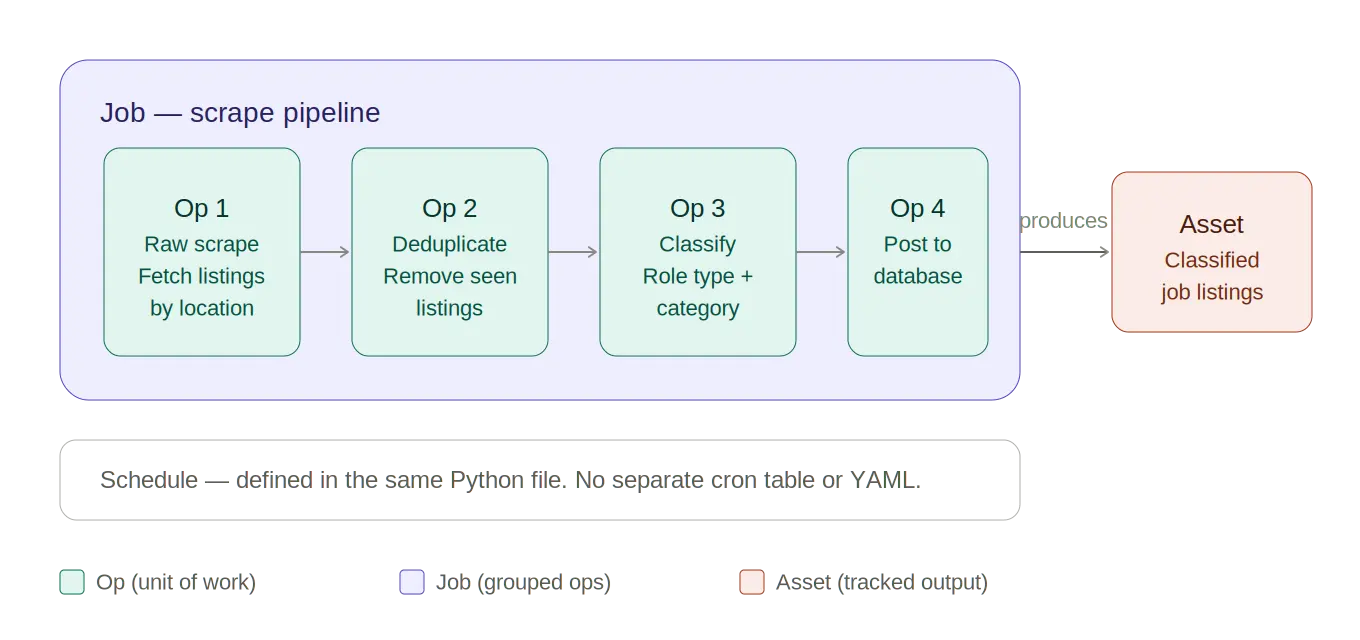
Figure 2: Ops chain into a Job, which produces a tracked Asset
What Changed for Us
Visibility. One dashboard shows every job, every run, every op: success, failure, timestamps. All four job categories, all in one place.
Alerting. Built-in failure notifications. Route to Slack, email, or webhook. We know when something breaks, not when a user reports it.
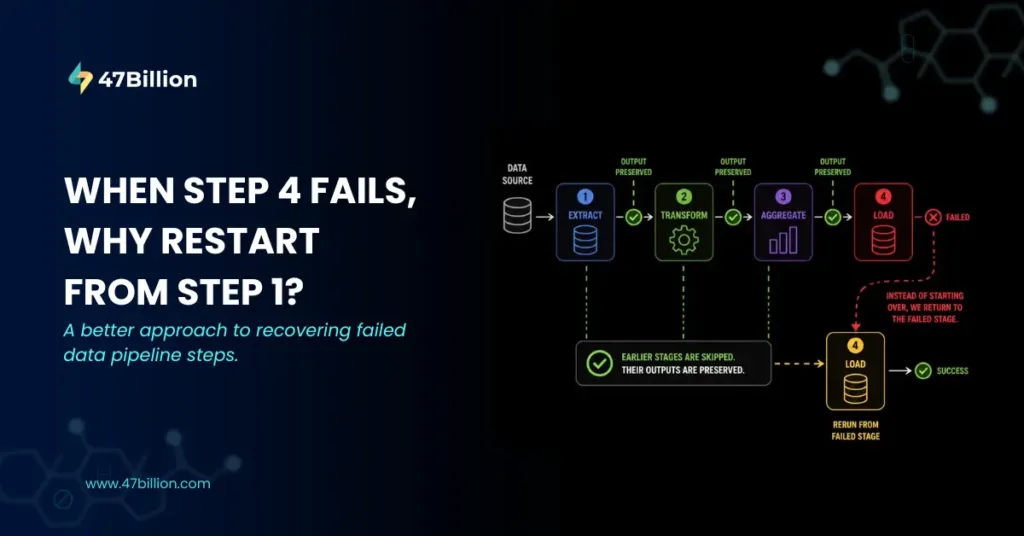
Recovery. Pipeline fails on op 4? Re-run from op 4. Earlier ops’ data is preserved. No need to re-run everything or write custom retry logic.
Concurrency. Running multiple scraping instances in parallel, different locations, same pipeline, just works. No workarounds needed.
Local development. dagster dev spins up the whole UI and daemon on your own machine, so you can materialize an asset and watch it run without touching a shared or production environment. This cut down the iteration time needed just to verify whether a job ran correctly.
Cron, Celery, and Dagster Side by Side
| Capability | Cron jobs | Celery + Beat | Dagster ✓ |
| Run history & logs | None | Requires Flower (separate) | Built-in dashboard |
| Failure alerts | Silent | Manual setup | Configurable out of the box |
| Mid-pipeline recovery | Re-run all | Re-run all | Resume from failed op/asset |
| Bulk data pipelines | Basic | Per-record only | Native bulk support |
| Asset / output tracking | None | Added 2025 (@materialize) | Native, purpose-built |
| Schedule co-location | Separate crontab | Separate Beat config | Same Python file |
| Resource footprint | Minimal (1 process) | Medium (broker+workers) | Higher; scales with jobs |
| Best fit | 1–2 scripts | Event tasks | Multi-step pipelines |
Why Bulk Data Changes Things
Celery is optimised for per-record work: one event, one task, one result. That’s right for transactional emails or per-document inference.
Dagster is optimised for the bulk model: take a large dataset, transform all of it at each stage, pass the result forward. Scraping is bulk. Recommendation generation is bulk too, you don’t compute one student’s recommendations, you process all students’ activity together and output recommendations for everyone in a single pass.
It also changes where the data actually lives. Raw scraped records, pre-aggregated activity logs, none of that intermediate stuff needs to touch Postgres. It sits in Parquet files instead, passed cheaply between stages through a Dagster I/O manager, and only the final, filtered output hits the database. Storage costs go down, the DB stays lean, and the pipeline itself becomes the record of what actually happened.
This is the same pattern we see across data engineering work at 47Billion: once you split the cheap, disposable, columnar storage from the database your product actually queries, costs go down and it’s just clearer what’s authoritative.
When Dagster Actually Makes Sense
Reach for Dagster when:
• More than a handful of scheduled jobs and tracking them has become a daily chore
• Multi-step pipelines where mid-failure recovery matters
• Bulk data, processing sets of records, not individual ones
• Audit-ability, knowing what each run actually produced
• Schedule and logic in one place, no separate config files to fall out of sync
If your cron jobs are simple and working, leave them as is. Once job count grows, pipelines become multi-step, or you lose visibility into what a run actually produced, Dagster becomes the more direct choice.