

Every day a large amount of content is being generated continuously on the internet. There are numerous blog posts, social media posts, reviews, ratings, comments, websites, images and videos about people, products, companies, regions, countries etc. This large content generated, targeted and consumed every day, affects public perception. In turn, it can strongly influence entities or events in either positive or a negative way. Given the sensitivity, there is a strong need to understand underlying patterns, trends and attribution in near real-time and use this information for corrective actions. For example, a news analytics service need to detect bias, fake news, analyze sentiments and public perception of various entities and topics of interest. A marketing agency need to understand sources of media bias and how to manage the perception.
Below I have described steps to analyze the unstructured data and provide actionable insights through visualization.
Data capturing
Most of the content is unstructured in the form of text, pictures and videos. A daily crawler can capture data from relevant websites, social media accounts, blogs etc. and store for analytics.
Meta-data extraction
Below are the various ways you can extract and associate meta-data from the captured unstructured content.
- Extract keywords and associated entities from a content source (text, pictures and videos)
- Extract named entities (people, products, companies and locations) and values (emails, telephone numbers, currencies, percentages, embedded URLs) in the source
- Extract named entities in a document, disambiguates and cross-links them
- Extract meta-data like author name, publish date, embedded RSS feeds, type of device used to create data, image resolution, IP addresses, location etc.
- Extract entities, locations and any other useful data from image and video analysis
- Detect and if needed, translate language
- Create a summary of an article
- Extract topics from an article
- Classify and cluster content according to pre-defined taxonomies
- Detect sentiment of a text in terms of polarity (positive or negative opinion) and subjectivity (opinion or supported by facts and figures from legitimate sources)
- Analyze sentiments towards entities found in the text or other media
- Analyze sentiments towards each aspect of an entity. For example, for a hotel, aspects are staff, location, nearby places etc.
Meta-data aggregation
The collected meta-data on each source can be aggregated and analyzed on different dimensions based on duration, sources, clusters, entities, keywords, authors, sentiments, topics, aspects etc. This aggregation can run daily or as often as needed to reflect real-time information. Such aggregations help in discovering patterns and trends which can then be visualized easily and drilled down to narrow details.
Visualization
Here are some of the interesting ways you can visualize meta-data extracted from unstructured data to show relationships, clusters, measures and trends.
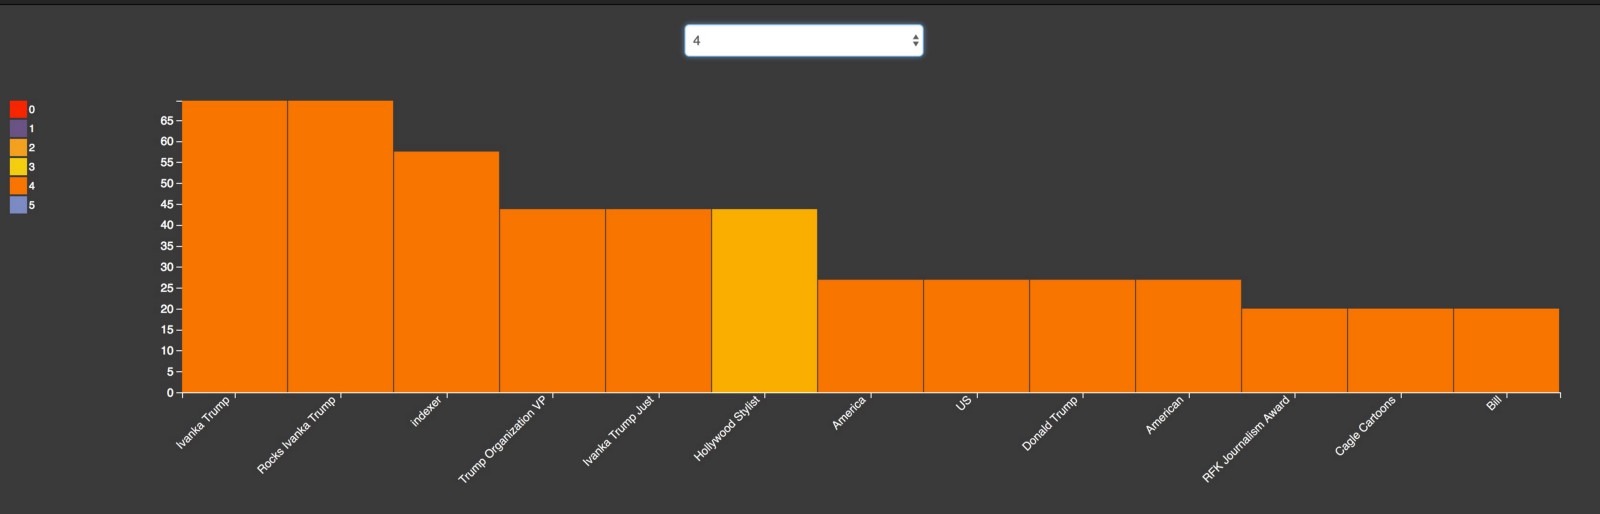
Media Polarization
This graph shows positive and negative sentiments of top media outlets publishing the stories about a particular entity. This is shown as a bar graph for each media outlet (0—5 in the graph below) showing average sentiment score of important entities within all the articles the media outlet created on the keyword.
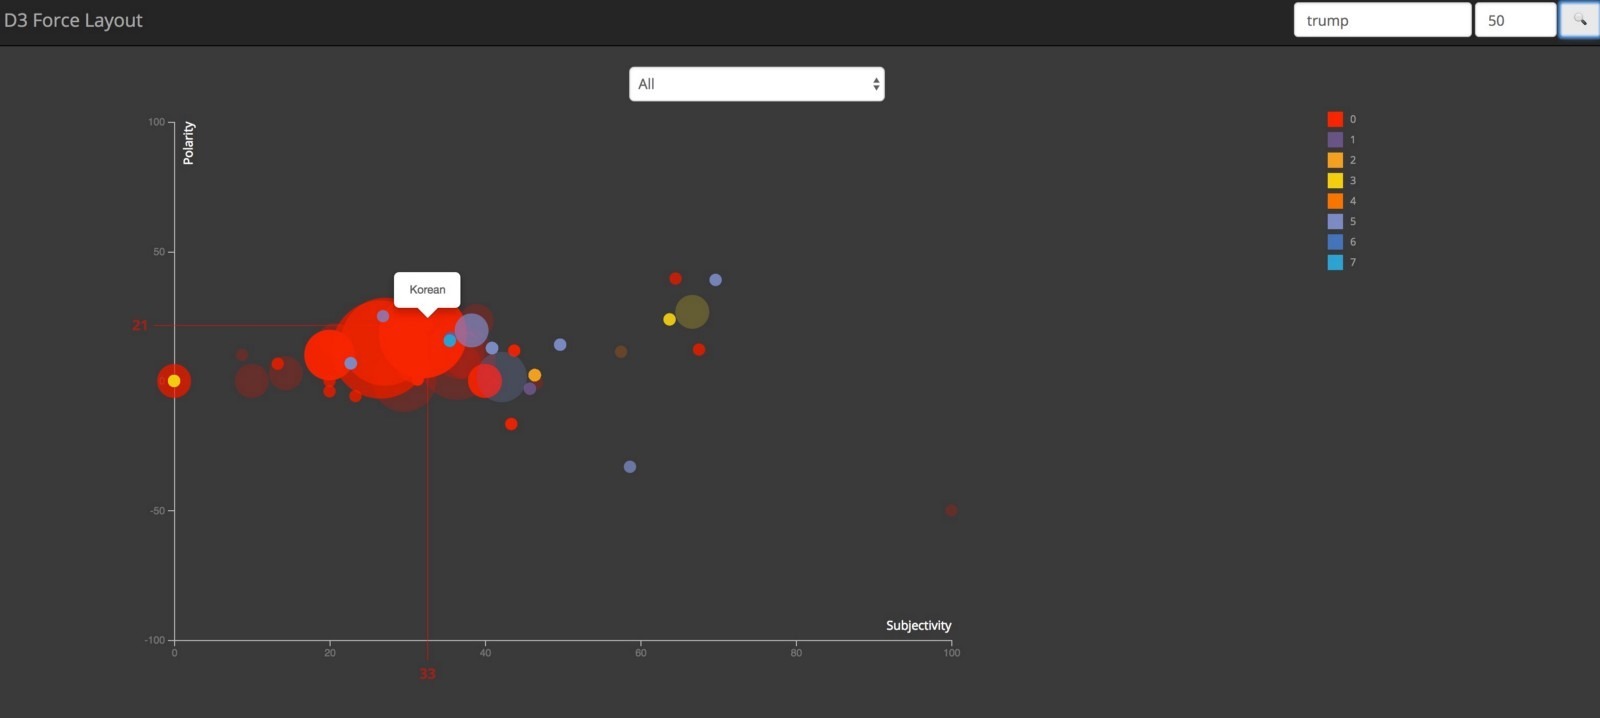
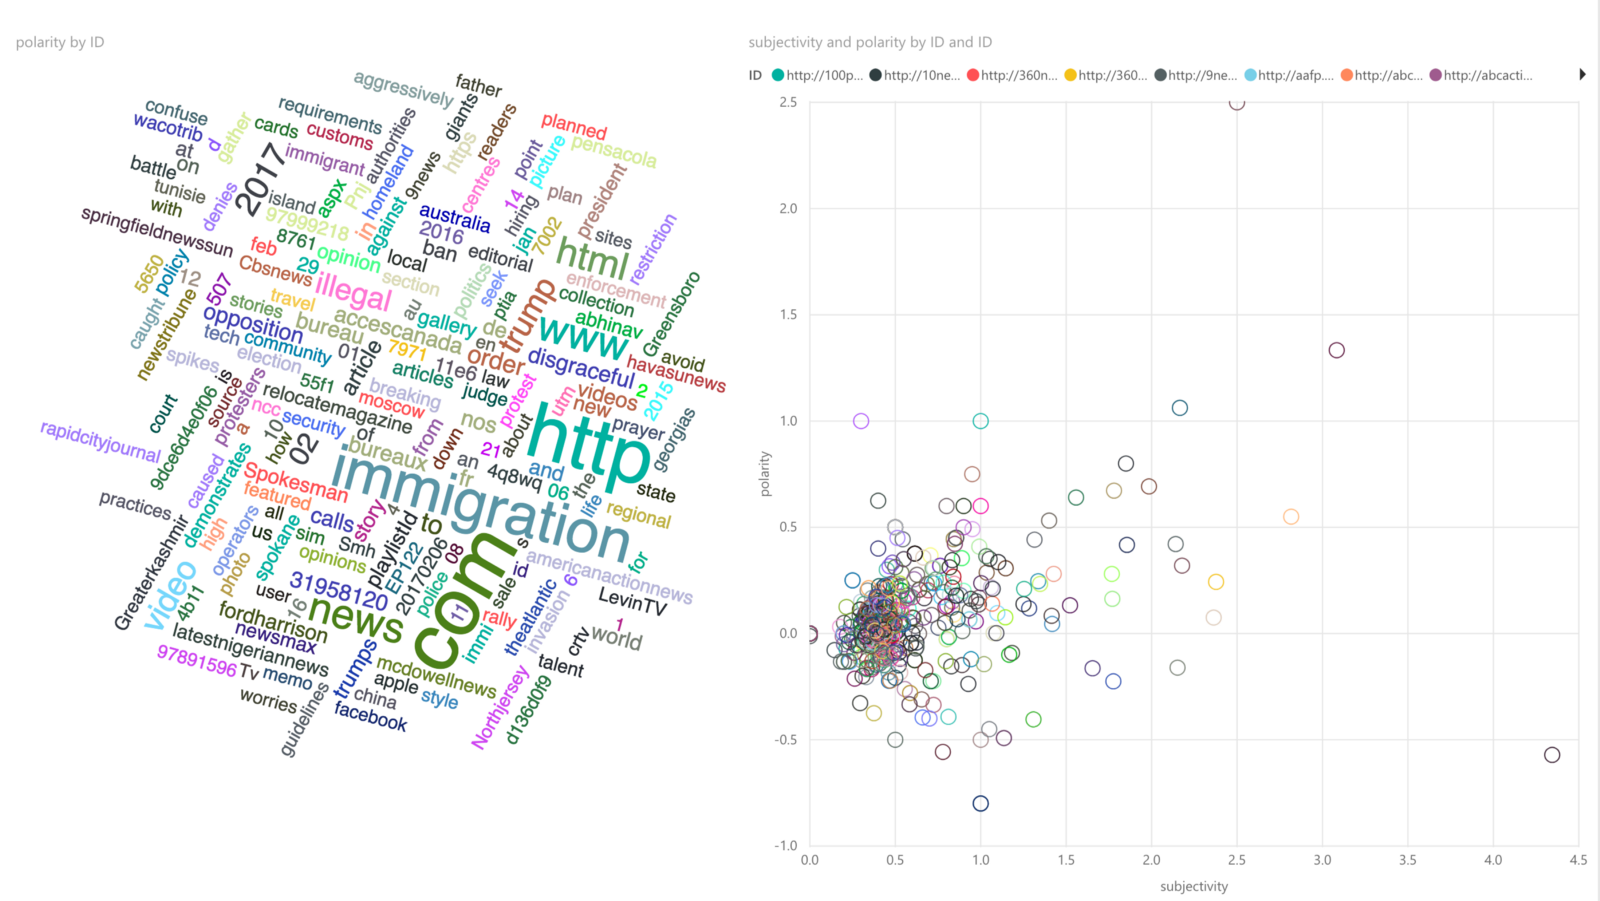
Entity Polarization
This scatterplot plots subjectivity against polarity. Each bubble represents an entity, with size denoting the frequency of occurrence and color represents clusters in which it is found. In this case, the outliers shows entities with highly bias (highly subjective and polarized sentiments).
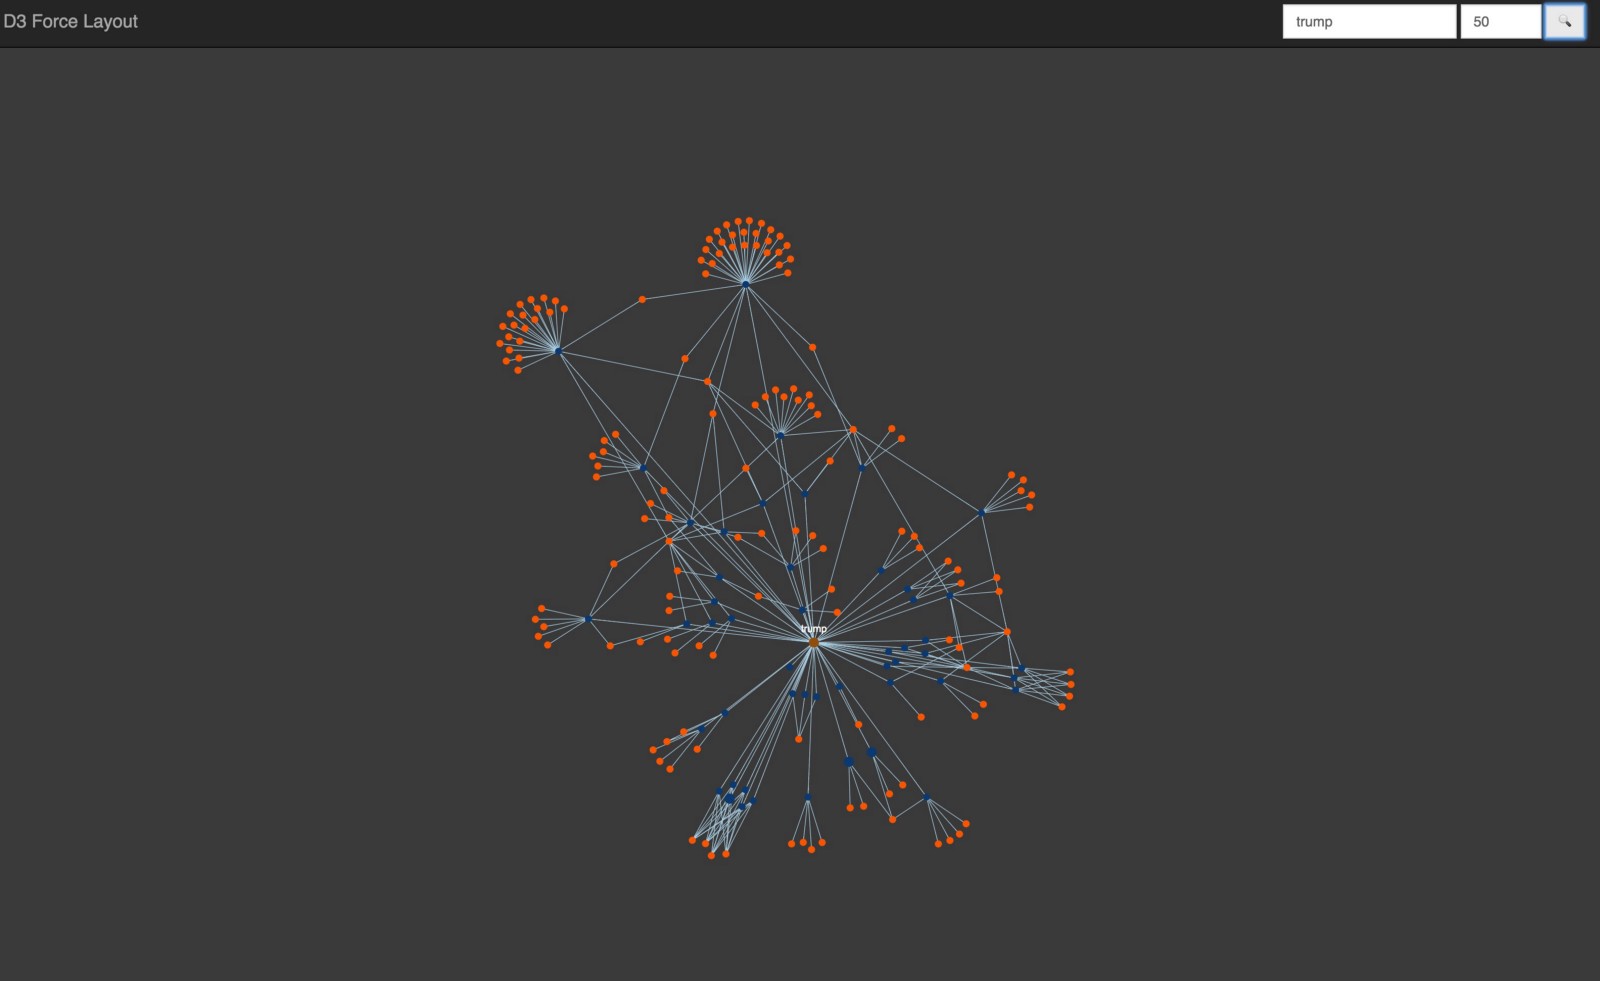
Keyword Entity Relationship
This graph shows association between articles and entities related to a keyword. This force-directed graph shows keyword at the center connected to all the articles which in turn are connected to entities found inside the article. This is a nice way to visualize various relationships between keywords, articles and entities.
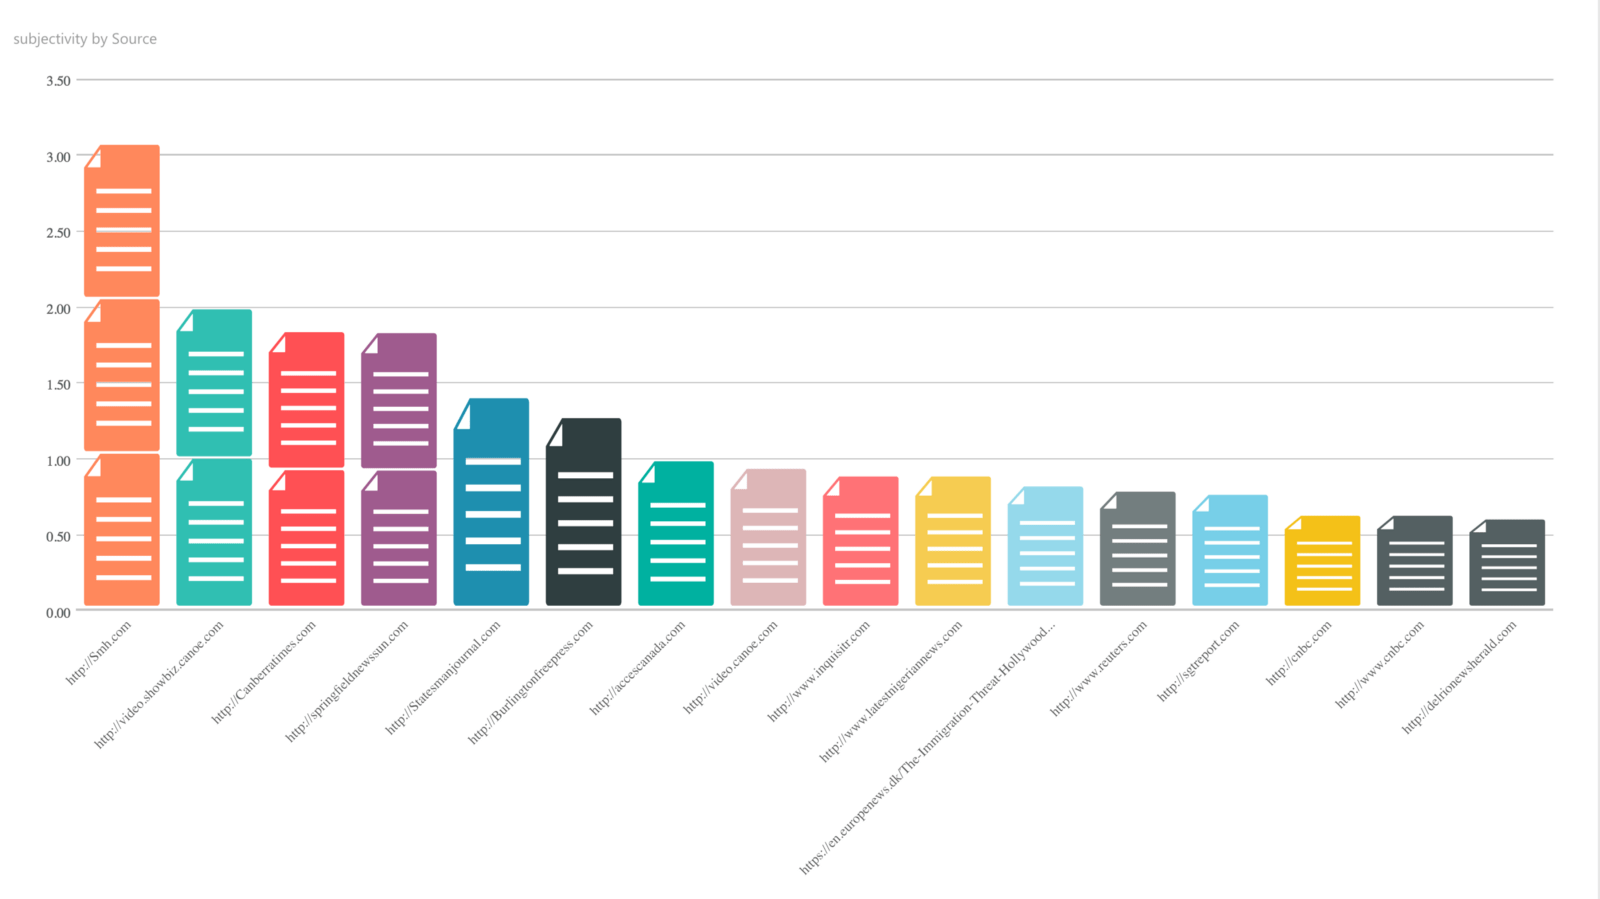
Subjectivity by source
This chart shows how subjective or opinionated is the source for a particular keyword. This can tell whether a source might be inherently biased towards a position with respect to an entity or event.
Tag cloud of important words
This visualization can show current topics of importance related to a keyword. For example, in the chart below, you can see that “immigration” is an important topic for the keyword search related to “Trump”.
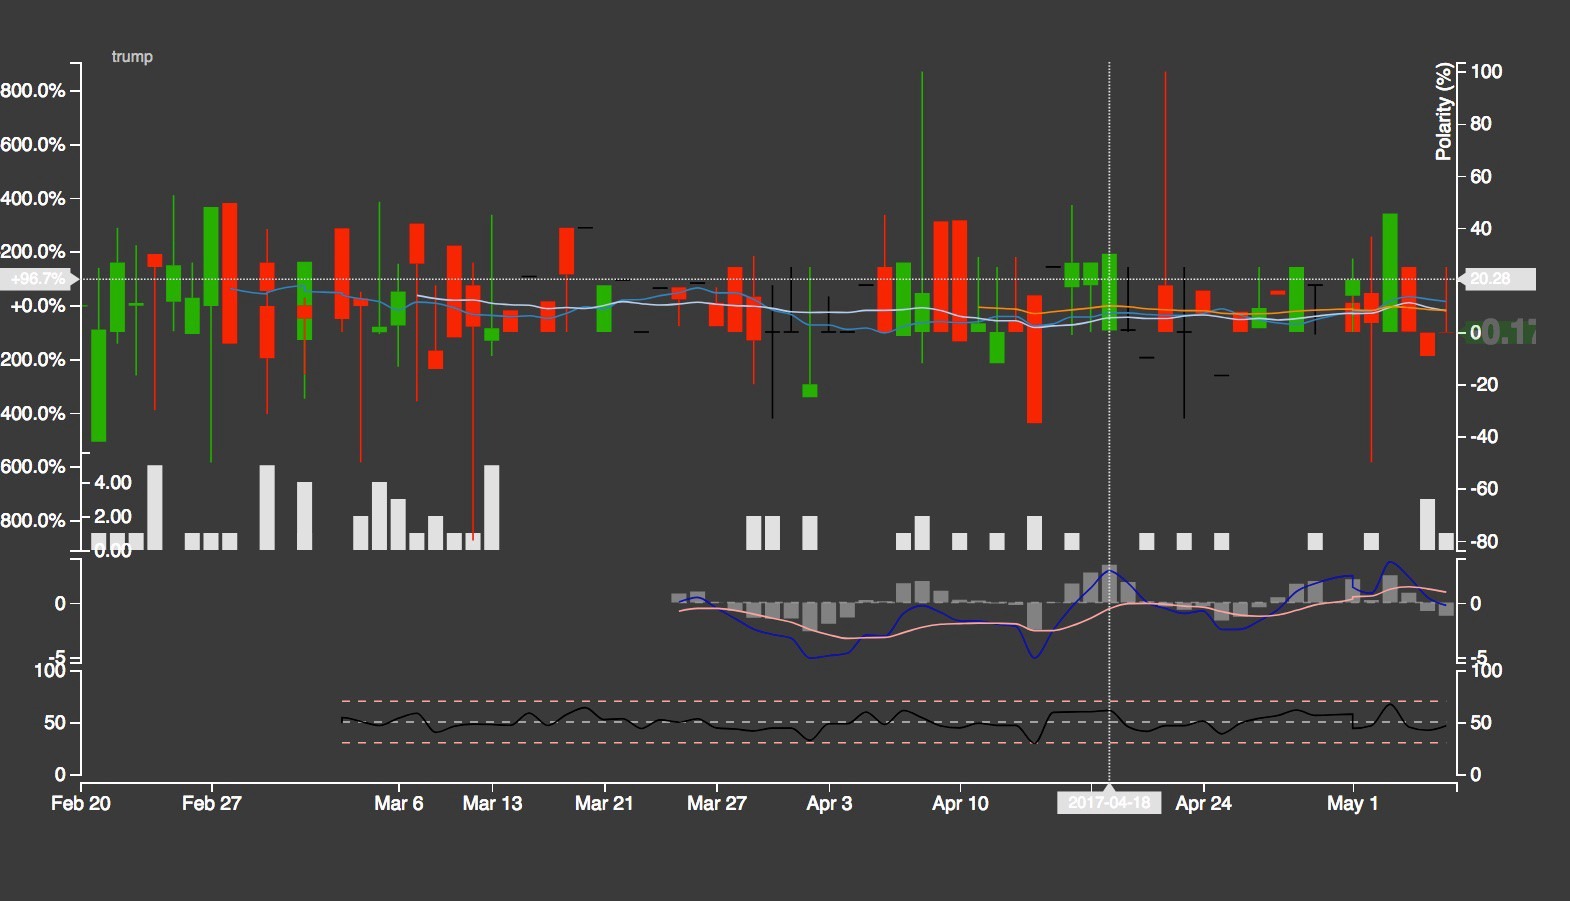
Subjectivity and Polarity Trends
A candlestick chart typically used to track stock movement, is a nice way of showing recent subjectivity and polarity trends related to a keyword. Based on these trend lines, you can find if a particular person, event, company is developing into a highly emotional and biased story and whether the bias is positive or negative.
Other interesting visualizations
A tree map showing entities and important words associated with a searched keyword. They can be shown in darker colors according to the importance (TF-IDF score).
Average of all Subjectivity or Polarity of all documents from a single source. This can show inherent bias from the source for a keyword.
Topic cluster in bubble chart for different articles.
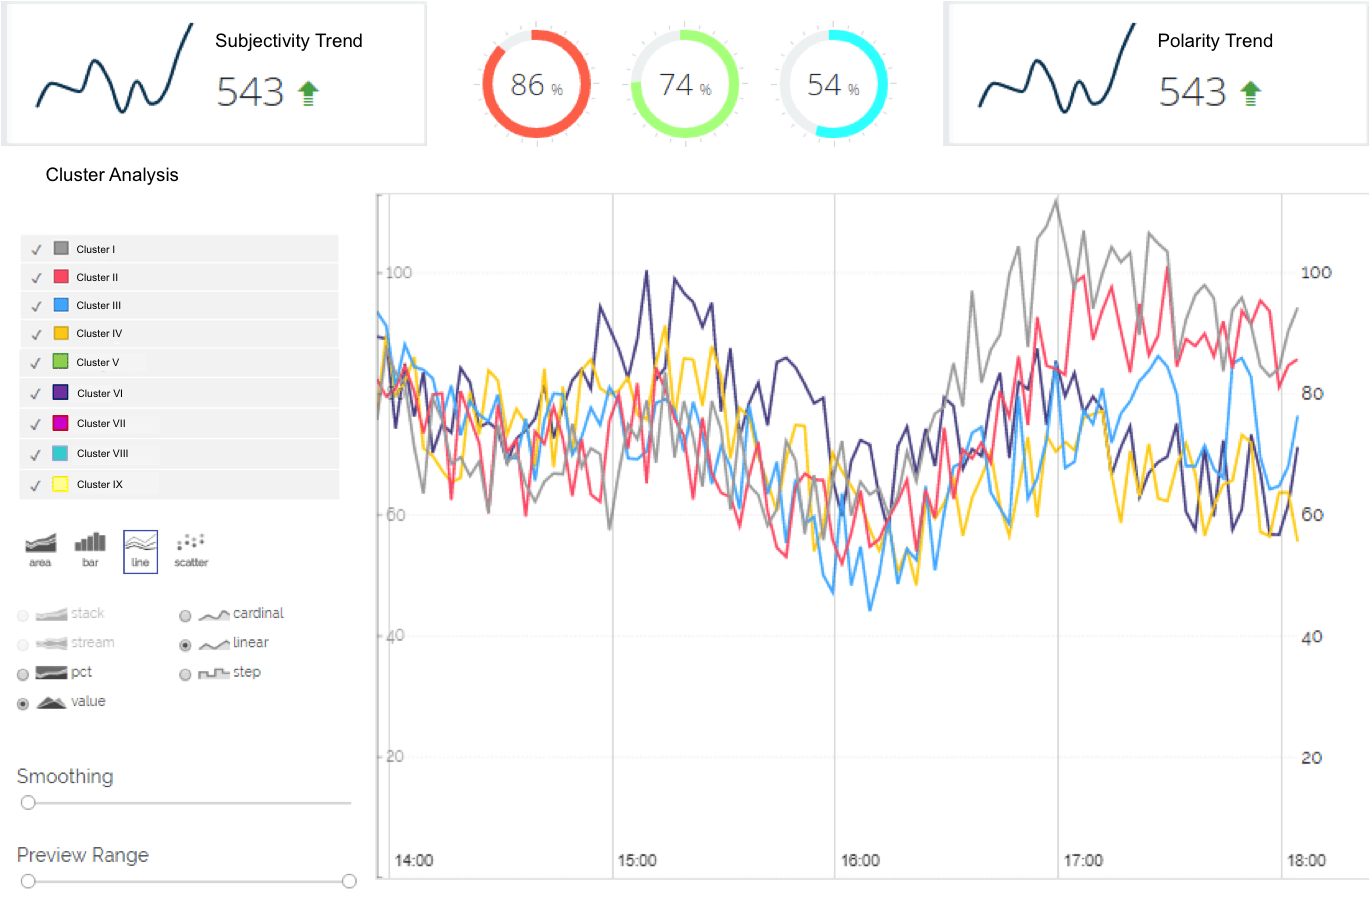
Dashboards
Various combinations of above visualizations can be combined together in a dashboard. Such a dashboard can provide an interactive way to visualize public perception and impact of on-going stories: A true visual story behind words on the web!
This article is a part of series of articles related to Design Thinking and User Experiences. If you are looking for a User Experience and Design team to build your solution, please contact us at hello@47billion.com.


