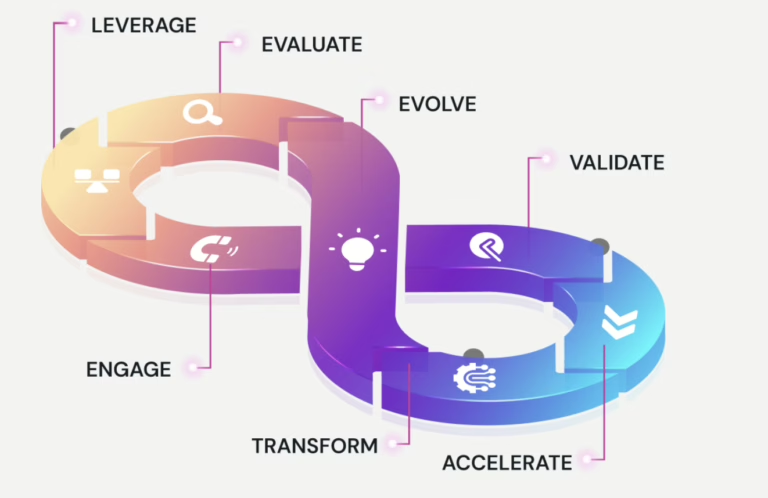
“The proper use of data creates a virtuous profit cycle for the mortgage industry.”
As the mortgage industry becomes more competitive and challenging, lenders will need to find new and innovative ways to leverage and analyze the available data to be operational, practical, efficient, differentiated, and grow their business. It’s not enough to use data to know ‘what’ happened in the past. Lenders need to know what is happening in the present and what is likely to occur in the coming future while they still can take corrective actions and decisions.
Companies that establish and continuously enhance their data analysis can reap the benefits of greater operational efficiencies, effectiveness, transparency improvements, risk reduction, and streamlined procedures. But the actual value of data insights is to create a competitive advantage in positioning themselves in advance of emerging market trends, identifying ways to improve profitability before anyone else, and most importantly, knowing how to meet the expectations of their borrowers and drive differentiated customer satisfaction.
Key benefits of Advanced Analytics in Mortgage operations
Advanced analytics employed in the mortgage origination domain helps mortgage lenders:
- Select and segment customers
- Formulate strategies for mortgage offers
- Predict the probability of delinquency
- Detect credit fraud
- Digitize and automate complex workflows
- Reduce turnaround times
- Accelerate the ROI
- Improve customer satisfaction
You can’t improve what you can’t measure
Running a lucrative mortgage business is never a static job. It often involves constant assessment and correctly making essential and impactful decisions that vary from time to time.
Are the loans that you originate lucratively?
When should you make the next hire?
How do you recognize and resolve bottlenecks in the process?
Far too many mortgage experts choose to make decisions on instinct, a feeling that is easily wrought by cognitive bias, and are left grasping for answers when things don’t work out. This is the beauty of utilizing KPIs (key performance Indicators) and metrics to aid business decision-making.
Mortgage lending KPIs and metrics track the effectiveness and efficiency of the loan process from start to finish, including sales, closing, and post-closure activities, application processing, underwriting, funding, and loan profitability. To develop the data analytics engine and identify the levers you can pull to change business outcomes. To explore basic and advanced data points that will be invaluable to begin understanding what’s going on under the hood of the Mortgage origination process, Marketing operations, Loan and customer information and debt collection.
Measure and Improve the Mortgage Operations
The KPIs that fall into this category are some of the simplest yet most important that a loan officer could track. They are broader-based in scope and provide a great deal of information on Mortgage overall health.
Cost-to-Close
Cost to Close KPI, as its name suggests, monitors how much it costs to close a loan. It calculates all direct and indirect mortgage costs, including advertising and sales-related charges, processing and administrative fees, and all loan-related closing costs.
Mortgages Closed per Closer
Closed Mortgages Closer KPI calculates each loan closing employee’s average productivity (volume per employee) and workload. Loan closing employees are often in charge of compiling all loan documentation for closing (e.g., borrower credit information, appraisals, tax documents, etc.) and loan documentation for loan servicing or sale to investors.
Mortgages Closed per Secondary Employee
Mortgages Closed per Secondary Employee KPI measures the average number of mortgage loans funded by the lending institution or company relative to the number of secondary loan marketing, reporting, and sales employees. This metric also measures the secondary mortgage employees’ workload and checks their performances.
Pull-Through Rate
The Loan Application Conversion Rate, or KPI Mortgage Pull-Through Rate, indicates the percentage of loan applications closed and funded by the lending institution. This KPI measures the efficiency, potentially wasted effort, and overall customer service levels within the mortgage lending function
Cost Per Unit Originated
This KPI assesses the efficiency relative to cycle times, staffing, office expense, and pull-through rate. Any flaws in these areas can result in high overhead costs, resulting in a high cost per unit. That impacts directly on profitability.
Average Origination Value
The average origination value KPI measures the total revenue generated for each Loan over a given time. It combines the underwriting and origination fees and any other fees added to income. If this KPI is low, it could mean that the average value of loans originated is down or that origination costs are below industry standards.
Cycle Stage Length
Examining cycle stages aims to delve further into the specific origination stages of each Loan and analyze the effects on a more granular level, similar to the more holistic average cycle time KPI has given above.
Fallout Rate
Lenders have conventionally used the fallout rate metric as a component of their rate-hedging assumptions. However, for a loan officer, the fallout rate is a barometer of their rate lock approach’s efficiency and ability to close loans.
Average Cycle Time
Average cycle time is an important performance metric to track the overall efficiency benchmark. Pull-through rates and loan profitability metrics have been directly related to cycle time.
Abandoned Loan Rate
This KPI measures the percentage of loan applications abandoned by borrowers after the lender approves.
Incomplete Application Rate
This KPI measures the percentage of closed applications for incompleteness or missing documentation. It also provides valuable insight into your workflow’s application and loan processing portions.
Optimize Productivity
Productivity typically measures the month-to-month basis and how many loans your team closes every month, closely linked with profitability.
Borrower Share
Borrower share KPI measures how many of your current customers are also mortgage borrowers at your bank or credit union. This KPI also helps find new leads while keeping initial lead-generation costs low.
Loan officer (LO) productivity
This is the most important metric that measures the performance of a loan officer. It is also the single most significant indicator of how well a lender serves its borrowers.
Debt to Income (DTI) Ratio
The DTI ratio KPI measures the amount of income a person or organization generates to service debt. A low DTI ratio implies that a borrower’s income is sufficient for debt payments, making them more appealing.
Early Payoff
Early Payoff KPI measures the mortgage prepayment penalty (some lenders charge when you pay part or all of your mortgage loan off early).
FICO Credit Score
A FICO Credit Score, or borrower’s credit score, is one of the vital indicators used to determine the probability that a borrower will make their mortgage payment. It creates a report that an investor might use to track the distribution of credit scores for loans a seller has delivered to the Investor.
Funding Quality
The funding Quality KPI uses to track and report the funding quality statistics for loans that a seller has delivered to the Investor.
Geographic Concentration
Statistical models reveal that a loan’s likelihood of good servicing is determined by geographic location and other critical performance variables. An investor can alleviate the risk of buying too many loans in a high-risk geographic location from anyone seller. It also ensures the diversification of their portfolio by offering higher premiums for loans in lower risk and/or higher profit geographic areas.
Loan Purpose Type
A Loan Purpose Type of Refinance KPI indicates that borrowed funds are used to finance the payback of a debt from the proceeds of a new loan using the same property as security.
Loan To Value (LTV)
This KPI is beneficial for the Investor that might track and report the distribution of LTV ratios for loans that a seller has delivered to the Investor.
Occupancy Type
This KPI creates a report that an investor may use to track and report the distribution of occupancy and property usage types for loans that a seller has delivered to the Investor.
Production
It creates a report that an investor may use to track and report seller production by loan program type.
Mortgage Loans Serviced per Mortgage Loan Servicing Employee
This KPI measures the average number of loans serviced (i.e., loans managed by the bank) by each Loan servicing employee.
Mortgages Closed per Loan Officer
This KPI calculates the total number of mortgage loans closed by the lending institution and the average number of mortgage loan officers or originators working for the institution over a given time.
Mortgage Applications per Processor
Mortgage Applications per Processor measures the productivity of individual mortgage processors and the overall efficiency of mortgage application processes.
Mortgage Applications per Underwriter
It measures the total number of mortgage loan applications submitted by potential borrowers through all channels (e.g., phone, branch, web, etc.) over a particular time.
Mortgage Loan Origination
Mortgage Loan Origination measures the average operating expense incurred by the lending institution to originate (i.e., close and fund) a single mortgage loan.
Mortgage Loan Servicing
Mortgage Loan Servicing measures the average operating cost incurred by the bank, or loan servicer, to service a single mortgage loan over a defined time (e.g., monthly, quarterly, etc.).
Mortgage Production per Loan Officer
The average dollar amount of new mortgages created by a single Loan Officer over a particular time is measured by Mortgage Loan Production per Loan Officer. This KPI, together with the total number of mortgages originated per Loan Officer, is a critical indicator of Loan Officer productivity and the profitability of the lending company.
Mortgage application approval rate
Mortgage Application Approval Rate measures the number of submitted mortgage loan applications approved by the lender concerning the total number of mortgage loan applications received over the same time.
Percentage of Mortgage Loans Abandoned by Borrower
It measures the number of submitted mortgage applications approved by the lender. Still, it is either not accepted or withdrawn by the potential borrower, concerning the total number of mortgage loan applications approved over the same time.
Quality Control (QC)
KPI uses to track the quality control statistics for loans that a seller has delivered to the Investor.
Mortgage Closing Cycle Time
Mortgage Closing Cycle Time is a vital mortgage lending KPI that measures the average number of days the institution requires to process and close a mortgage. This KPI is important to internal operational performances and the overall mortgage lending customer experience.
Servicing Issues
The Investor uses this KPI to track and report servicing issue statistics for loans that a seller has delivered to the Investor.
Measure and Improve Mortgage Marketing Operations
A data-driven analysis helps marketing operations leaders find gaps in the Marketing strategy, gain insights, and discover new trends. Despite tremendous competition for attention and many KPIs to monitor, many marketing executives overlook the most critical, resulting in inaccurate data and a waste of money and time. Following are the vital Mortgage Marketing KPIs that leaders must follow:
Cost per lead
This is a crucial metric to track which marketing efforts give the most bang for the buck and which ones are just sputtering out or a waste of time.
Amount Spent/Leads Generated
Amount Spent/Leads Generated KPI measures the amount spent per lead. The lower the amount of cost spent, the higher the profit.
Documentation Type
This KPI helps to record documentation requirements for a mortgage loan. Documentation includes a fully completed Verification of Employment (VOE), Verification of Deposit (VOD), and Verification of Mortgage (VOM) forms. A loan with Full Documentation represents the least amount of risk for an investor.
Application Approval Rate
This metric provides crucial insight into your loan application workflow and client acquisition.
Net Charge-Off Rate
This KPI effectively represents the debt a lender believes it will never collect compared to average receivables.
Customer Acquisition Cost
Lenders use this KPI to determine how much of their resources can profitably be spent on a particular customer.
Mortgage Lead Conversion Rates
It’s essential to track how many leads from marketing channels are converting into loans.
Profit per Loan
The profit per Loanmetric assesses the health of mortgage operations.
Customer satisfaction
This KPI is used to evaluate customer satisfaction through the Referrals and reviews method.
Outstanding Documents
The “Reporting Mortgage Loan Outstanding Documents” KPI details steps for creating a report that an investor may use to track and report the number of outstanding documents (Legal / Compliance and Credit) for loans that a seller has delivered to the Investor.
Marketing success metrics
Measuring your marketing results to identify which activities generated the most leads can show you what worked and didn’t to put your money and effort where it will be most beneficial.
Number of inbound leads
This KPI is used to check the marketing efforts and the number of leads generation (via email campaigns/word of mouth/ your website) and helps refine the marketing strategy.
Velocity
This is the essential KPI used to check the number of days required to close the application. Logically, faster time-to-close will positively impact your pull-through, productivity, and cost-to-close.
Amount Collected per Collections Employee
It measures the average amount of delinquent balances collected per employee. This KPI is a simple measure of employee productivity and overall work quality within the collections function.
Origination Revenue per Mortgage
Origination Revenue per Mortgage measures the total revenue earned by the lending institution for each Loan originated over time.
Measure and Improve Mortgage Loan and customer information
Tracking commercial loan officer KPIs can improve the performance of your entire commercial lending operation, highlighting areas that need attention and then measuring the results of any changes.
It helps gauge how long it takes to underwrite a commercial loan; you can better understand how well your internal teams of loan officers, underwriters, customer information, and credit analysts communicate and collaborate.
Early Payment Default (EPD)
In the mortgage industry, an Early Payment Default (EPD) is a mortgage loan that goes 90+ days delinquent or into a default status in its first year. The “Reporting Early Payment Default (EPD)” KPI details steps for creating a report that an investor might use to track and report a seller’s EPD percentage. A high percentage of loans with early payment default from a single seller could represent a significant risk to the Investor.
Mortgage Loan Delinquency Overview
Investors use this KPI to track and report delinquency statistics for mortgage loans acquired from their sellers. A mortgage loan that is 30 to 60 days past due with no payments being made is considered a delinquent or default status. Outstanding mortgage loans run a higher risk of bankruptcy or foreclosure and, from a servicing perspective, are not as profitable as loans with current payments.
Repurchase & Indemnity
This KPI uses to track and report repurchase and indemnity statistics for loans that a seller has delivered to the Investor.
Measure and Improve Mortgage Debt collection
However, by measuring the correct debt collection KPIs, you can better understand your operations and begin maximizing performance. Therefore, it is essential to consider the return on investment offered by ensuring the collectors have all the necessary tools. This will ensure that the results achieved outweigh all the expenses.
(DSO) Days Sales Outstanding
It is a commonly used KPI in the consumer lending business. Days Sales Outstandingindicates the average number of days the customer loan has been past due from when the payment was due. It shows the lender how long, on average, it should take him to collect from debtors.
(CEI) Collector Effective Index
CEI is similar to DSO and assesses the effectiveness of the individual collector. Therefore, it is another alternative to evaluate a company’s efficiency and its operations. The CEI KPI will display the amount of money collected in a given period vs. the total receivables due for that same time at the collector level.
Right Party Contacts (RPC) rate
It is a more specific metric for calculating the business’ efficiency in its debt recovery. RPC calculates the ratio of all outbound calls made to the person who owes to the industry.
(PTP) Percentage of Outbound Calls Resulting in Promise to Pay
This is another introductory rate in determining your overall collector efficiency. PTP is calculated in percentages, and it shows the percentage of all the calls made to a debtor that ends with a promise to pay the debt amount.
Profit per Account (PPA)
It asses the number of returns on average that each account has generated in collections. This KPI seeks to show the extent to which the business benefits, even as the collectors continue to follow up on unpaid debts.
Bad Debt to Sales
The bad debts to sales ratio are calculated from the total value of debts and sales, expressed as a percentage. A lower rate shows that the business is employing effective measures in recovering its credit. On the other hand, a higher ratio means that something has to be done to recover more debts.
Active Customer Accounts per Credit and Collection Employee
This KPI shows the total number of active accounts a collection employee is handling at a given time to the total number of active accounts the business has. This shows great effort on the part of the business in debt recovery.
Cost Per Sales Dollar
It uses the number of dollars spent in the credit and collection effort to generate sales.
The cost of collections
The cost of the collection refers to the cost incurred by the company in bad debt collection. It is a percentage representation of the amount paid to attorneys or collecting agencies against the total collected amount.
High-Risk Accounts
The High-Risk accounts KPI identifies the lousy debt accounts with high value and high-risk potential so they can be collected as a priority. This is meant to maximize profits at the same time minimizing potential losses.
Conclusion
No business has more data than a mortgage: it’s inundated with data. And yet, when you compare it to the payments industry, or the credit card industry, specifically, the use of data, the available proportion of data is probably the lowest, and the information itself is very unorganized. So, it’s great that the industry is willing to join hands and begin to think about data in a forward-looking way and take unstructured data and make it structured.


