Data has become the core of modern business, and it is expanding more than ever. But these large datasets are not of much use unless organizations can make sense of it. That’s where Business Intelligence comes into play.
If you are thinking about utilizing a platform that helps you pluck helpful, actionable insights from your data, then you are at the right place. In this blog, we are describing end-to-end Power BI implementation.
What is Power BI?
Power BI is the collective name for an assortment of cloud-based apps and services that help organizations collate, manage and analyze data from various sources through a user-friendly interface. It enables you to create a narrative around your data and tell a compelling visual story with actionable insights.

Below are the steps for Power BI implementation –
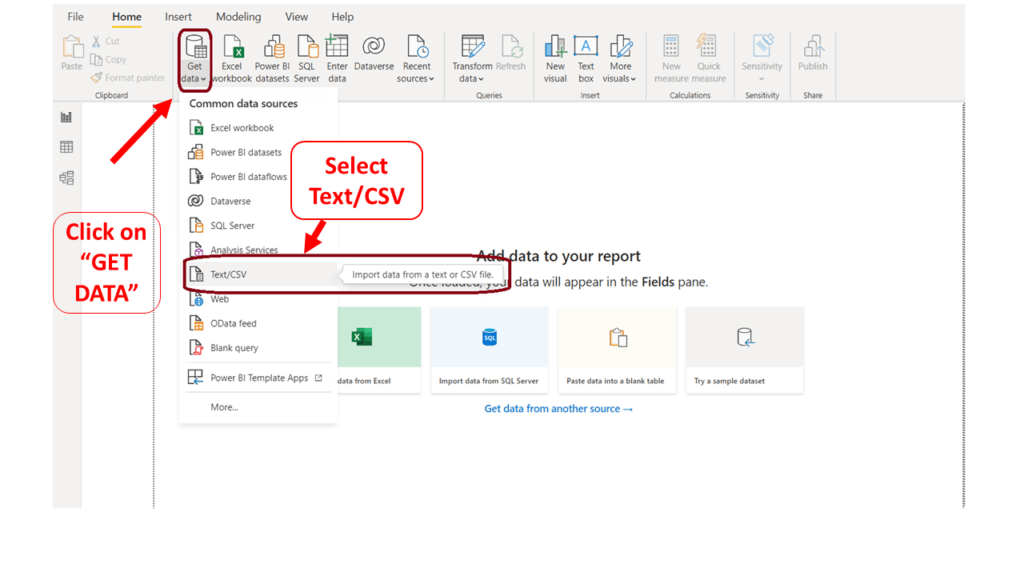
1. Get Data
We are using widely used and publicly available data for visualization – “TLC Trip Record Data,” popularly known as “NYC Taxi data.” We can find it over the website (https://www1.nyc.gov/) which provides taxi trip records from 2009 to July 2021.
Visit the URL mentioned above, which has links to all trip records from January 2020 to December 2020, zone lookup tables, and data dictionary -
https://www1.nyc.gov/site/tlc/about/tlc-trip-record-data.page
Now download “Yellow Taxi Trip Records” for January, “Taxi Zone Lookup Table” along with “Yellow Trips Data Dictionary.”
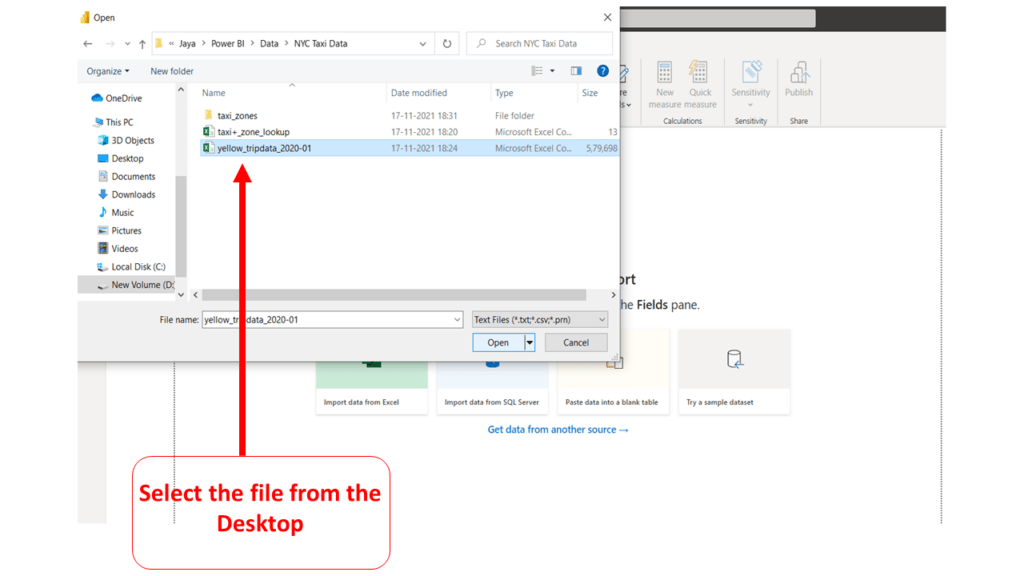
2. Extract Data
As you can see, the data is in CSV format. We need to import this data to Power BI as we need to confirm whether there is any requirement for transformations. The file contained 64+ lakh records with 18 columns, and we easily imported it to Power BI. Also, we imported the data from the “Taxi Zone Lookup Table.”
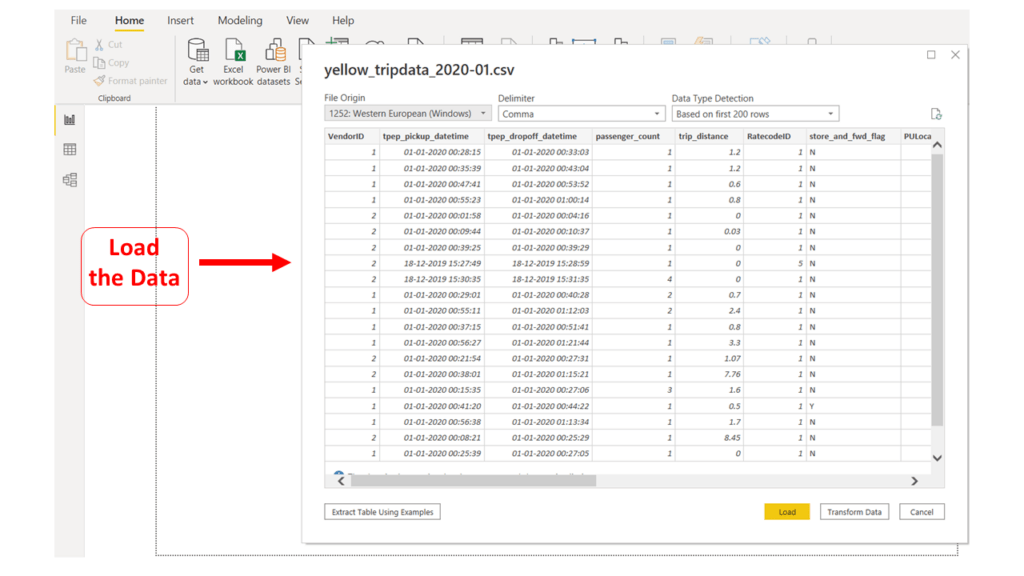
3. Transform Data
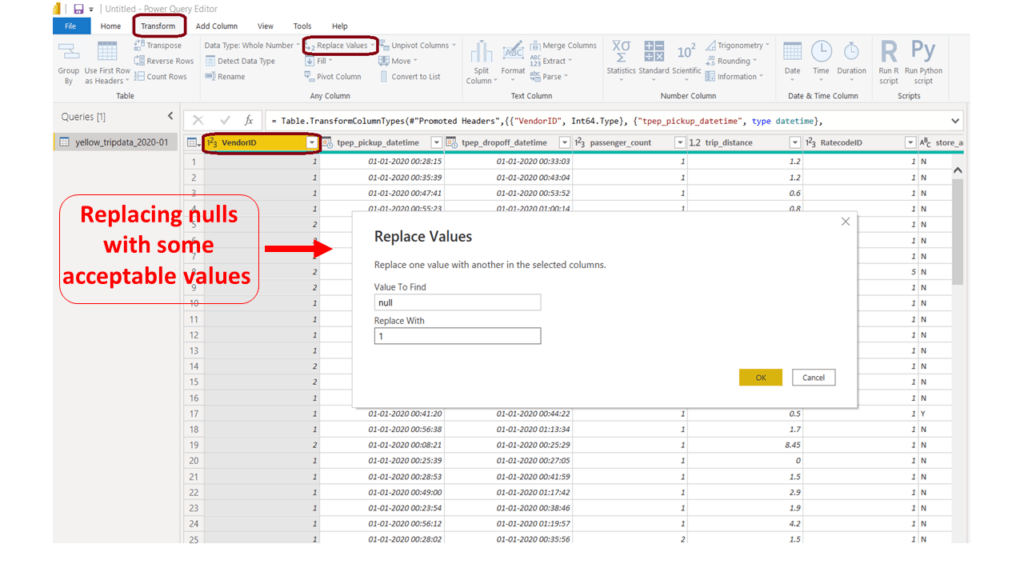
At this stage, we checked the data superficially and found that some columns had few nulls. Thus, they require transformation operations. We used the following Power BI transformation features –
- Replace Values – To replace nulls with some acceptable values
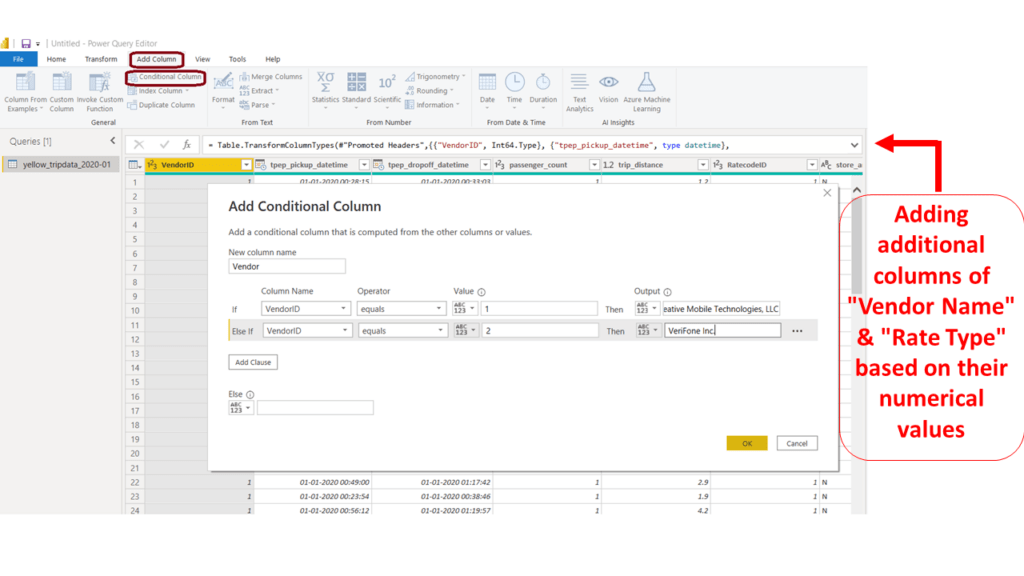
- Conditional Column – To add additional columns of “Vendor Name” & “Rate Type” based on their numerical values. (“Yellow Trips Data Dictionary” provides these details)
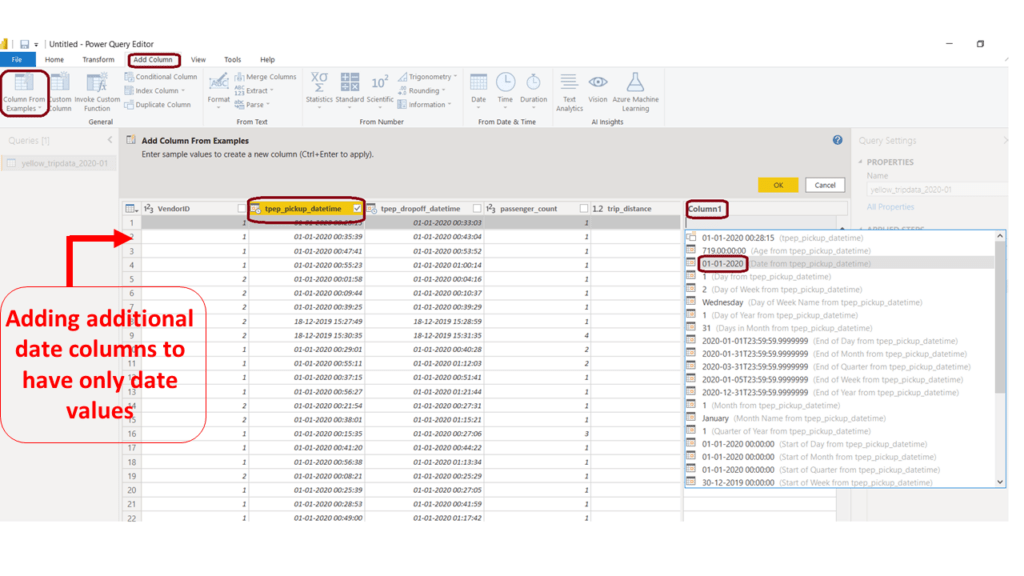
- Add column from Examples – To add additional date columns to have only date values from trip pickup DateTime & trip drop DateTime columns.
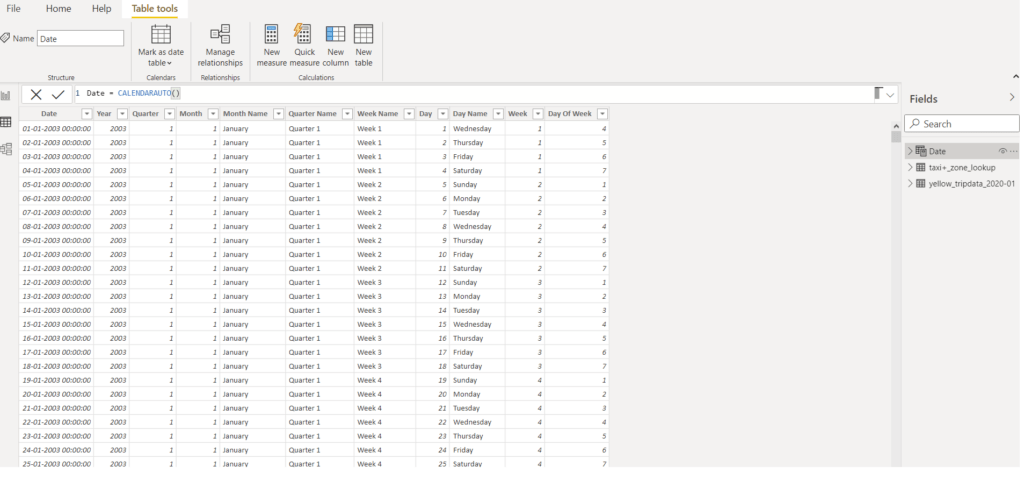
Also, Power BI has a feature to create a date table. We created a date table having date hierarchy columns like the year, quarter, month, week, and day. Timeline-based reports have drill-down features which use the columns mentioned above. We can drill through a date hierarchy report from “Year” to “Day.”
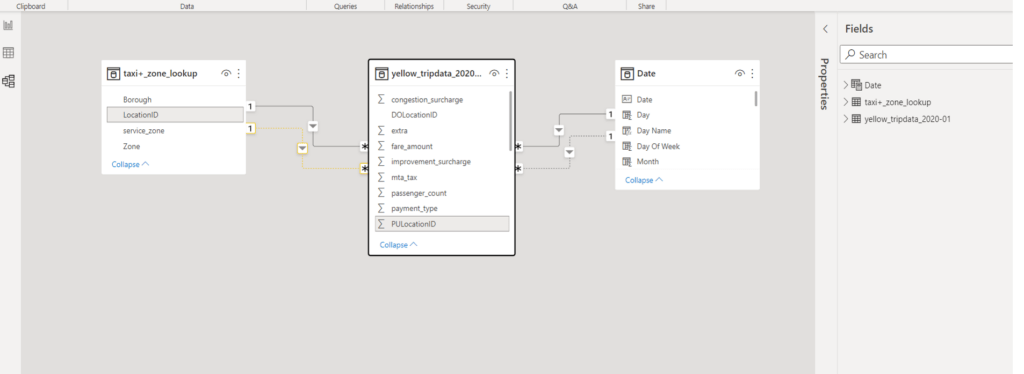
4. Data Modeling
Data modeling is used to connect multiple data sources in Power BI using a relationship. A relationship defines how data sources are related, and based on these; you can create exciting visualizations on various data sources.
We have the following data sources ready with us now.
- Yellow taxi trip data
- Taxi zone lookup table
- Date
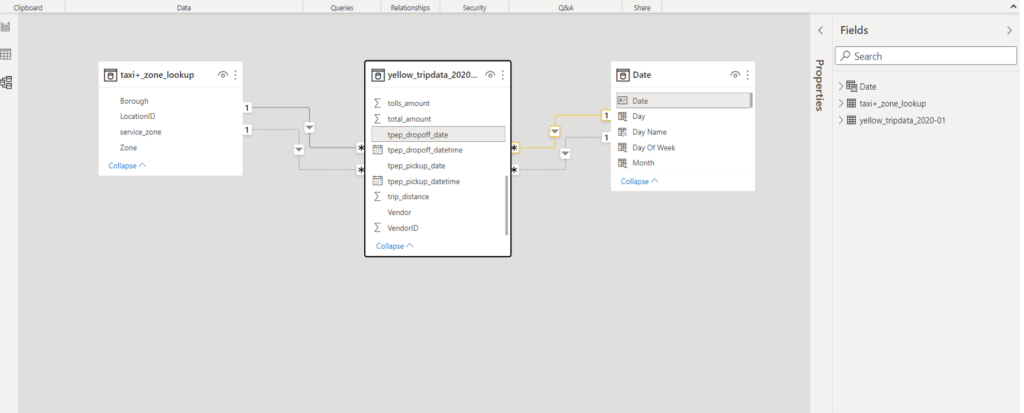
Thus, we created a relationship between the LocationID of the zone lookup table and pick and drop LocationIDs of Yellow taxi trip data.
We also created the relationship between the Date column of the date table consisting of pickup and drop off date columns from yellow taxi trip data.
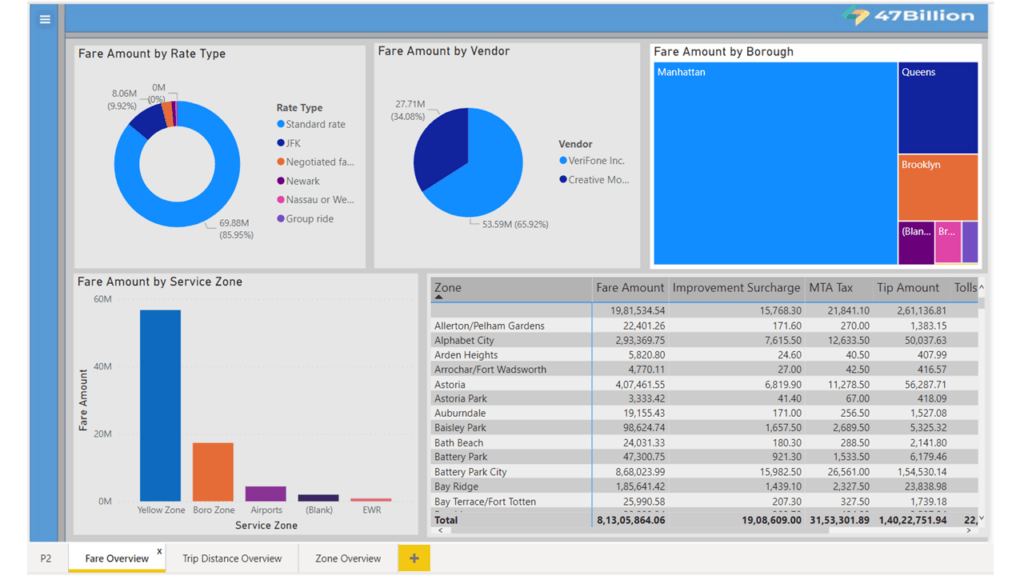
5. Data Visualization in Power BI
Power BI has got several visuals such as stacked, line, pie, donut, map, and scatter charts. Using the easy-to-use interface and visual, we prepared data visualizations.
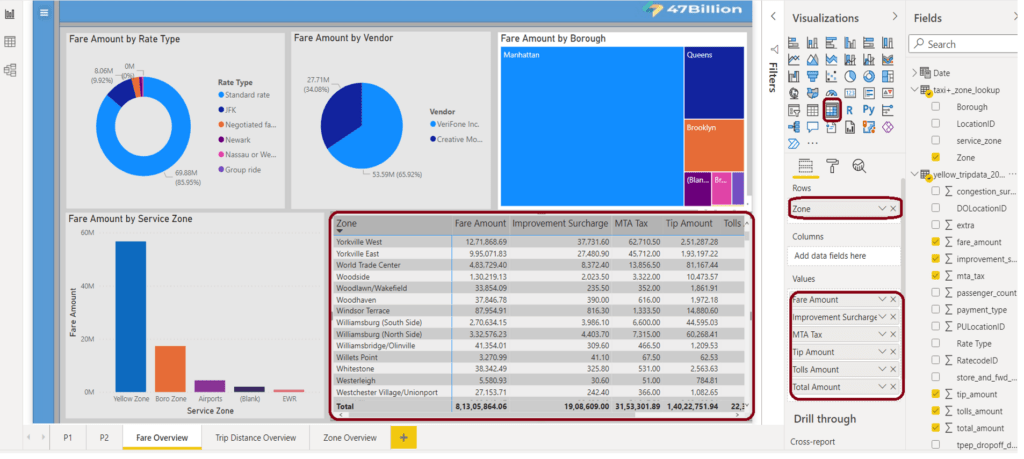
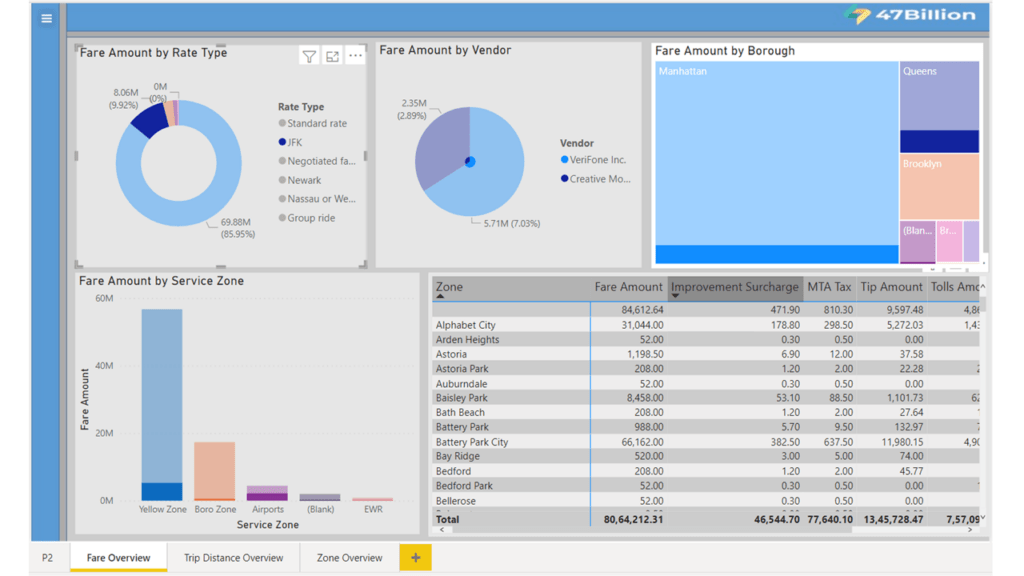
Power BI has got several amazing features and one of them is, the “Cross Highlighting” feature. Suppose you have multiple visuals over a single interface. In that case, we can click over any visualization element, highlighting all other visualizations on the page corresponding to the part clicked. Check the pictorial representation-
All elements Highlighted in the below diagram –
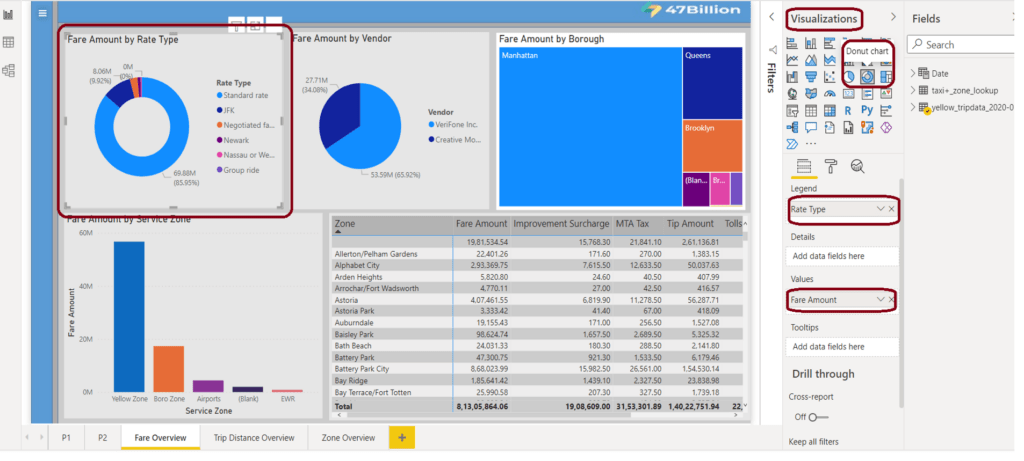
Single element is highlighted from the first visual in the above dashboard –
(All other visuals got impacted corresponding to the highlighted element)
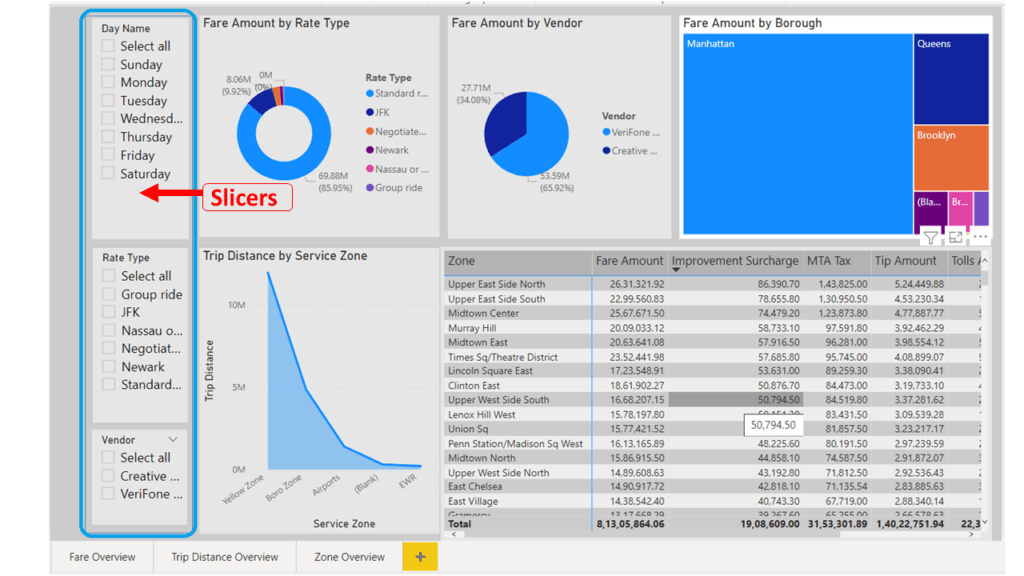
Slicers –
In addition to graph plotting visuals, it also provides slicers to create data filters.
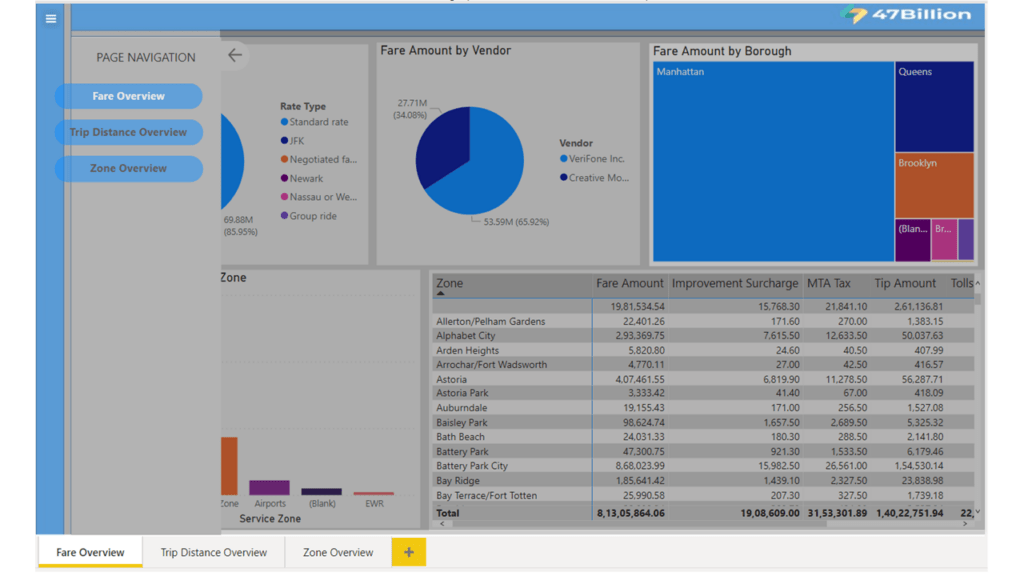
Page Navigation –
Power BI has also got some cool features like bookmarks, buttons & selections. We can create page navigation similar to the web interface.
The Path ahead
Power BI has several other features like Direct Query, DAX functions, themes, tooltips, custom backgrounds, and conditional drills. They help make more meaningful reports and dashboards that bring value to businesses. We will be covering them as well; till then, stay tuned with us.
Discover how data visualization with Power BI can help your business, lets connect for your data visualization project.