

“It’s not the companies that are competing. It’s the supply chains that are competing.”
Wael Safwat, SCMAO
This is so true!!!
We can see that competition is not between one company to another company. Instead, it is more appropriate to say the supply chain of one company competes with another company’s supply chain. Today, the supply chain has become the backbone of the business: an ever-shifting ecosystem that ensures the easy, well-organized, and consistent delivery of products/services from a supplier to a client/customer. But it has become more complex over time as companies are increasingly collaborating with international partners and are under pressure to supply things as quickly as possible.
Businesses are constantly reminded that they need to be more agile and resilient to survive. But what does this mean when it comes to Supply Chain Management and how to check the effectiveness of the chain? Commercial growth will suffer if the supply chain lacks structure, vision, and efficiency or is fragmented. Therefore, companies are looking for opportunities to make Supply Chain processes faster, cheaper, and more accessible in that long journey from a raw materials supplier to the end-user. This is where the important supply chain analytics come in—which can turn the overwhelming amount of data into digestible dashboards, reports, and visualizations that influence vital decisions and prime to better results.
Supply chain Analytics
Supply chain analytics analyses the information companies draw from several applications tied to their supply chain, including supply chain execution systems for procurement, inventory management, order management, warehouse management and fulfillment, and transportation management (including shipping). A supply chain is like dominoes: each step in the network affects the one that follows it. Ultimately, any issues at any stage could impact the ability to meet customer expectations.
The success of a company’s supply chain management can be assessed and measured in different ways. The measurement criteria a company chooses are often specific to the type of business it is engaged in, so it will include the most crucial aspects of effectiveness for the business. However, the key performance indicators (KPIs) established by the company illustrate the gap existing between planning and execution in the supply chain and are indicators used to monitor one or more of the following indicators: cost, value, service and waste, and the chain from the manufacturer to the customer.
Be SMART: How to define Smart KPIs that drive better results
A well-known saying is ‘what gets measured, gets done.’
Supply chain KPIs help to make business decisions related to expansion and business development or improve the company’s order fulfillment, demand forecasting, inventory management, reducing excess and obsolete inventory, transportation, or warehouse management easier. Specifically, they will reveal any shortcomings, allowing us to use our strengths to improve supply chain operations. So, ensure that the KPIs are SMART: Specific, Measurable, Achievable, Relevant, and Time which determines the main goals of supply chain metrics to increase productivity and improve customer satisfaction.
There are different KPI metrics used to measure various stages of the Supply Chain. For a better understanding, we can categorize it into the following stages where each stage is interconnected and interdependent:
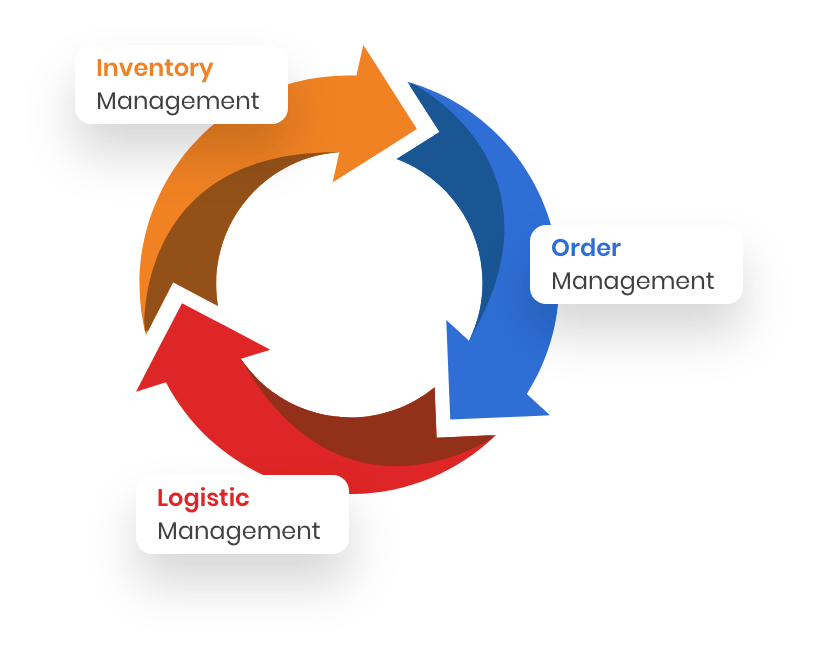
Order management KPIs
The following KPIs are used to check the effectiveness of Order Management from Manufactures to the client/Customer:
- Perfect Order
Perfect order or Perfect Customer order Rate KPI measures the number of orders shipped without problems (on-time delivery, incomplete delivery, damage, delay, or inaccuracy). Perfect Order KPIs help in determining customer satisfaction. These components also show the additional costs incurred by issuing a refund and offering the return to the customer.
The main components of the Perfect Order KPI are:
On-time delivery. It determines the percentage of sales deliveries made on time to the customer.
In-full delivery: It tracks the percentage of sales deliveries made correctly, i. e. the right customer received the right package.
Damage-free delivery. It calculates the number of sales ordered that arrived in perfect condition (without any damage) to the customer.
Accurate documentation. It measures the percentage of sales deliveries delivered to customers with valid documentation. These documents mainly include commercial invoices, labels, packing lists, and advanced shipment notifications (ASNs).
Fill Rate. This KPI is used to keep track of the Order and line fill rates. Fill rate provides information on customer satisfaction as well as delivery service effectiveness. It’s calculated as a percentage of packages or SKUs dispatched successfully on the first attempt, such as:
Order fill: It helps in measuring the percentage of orders that are successfully completed on the first shipment.
Line fill: It helps in measuring the percentage of order lines successfully delivered on the first shipment.
Unit fill: It measures the percentage of items that are successfully delivered on the first shipment.
- Customer order cycle
This KPI depicts the time between when a customer places a purchase order and when the order is delivered to the customer successfully. If the cash-to-cash cycle time increases, but the customer order cycle isn’t, it indicates issues with the former.
- Days Sales Outstanding (DSO)
This supply chain KPI reveals how fast you collect payments from the customers. A low Days Sales Outstanding number translates to monetary leanness and better productivity of the business operations and vice versa.
- Cash to cash cycle time
It displays how long it takes you to pay for raw materials and receive payment for what you sell. This supply chain KPI’s low value suggests increased leanness and profitability, and vice versa. It also defines how competent and efficient your supply chain assets, such as shelves, workstations, and trucks, are.
- Forecast error
The forecast error KPI measures uncertainty and drives all responses to uncertainty, such as safety inventory, excess capacity, etc. It depicts the difference between actual demand and forecasted demand.
- Capacity Utilization
This KPI shows how much of a company’s resource is being used. This resource could be the manufacture of commodities or professional services. This metric is used essentially for maintenance management and resource tracking.
- Freight Bill Accuracy
Billing accuracy is critical to profitability and customer satisfaction; therefore, tracking this particular metric will help in spotting the detrimental trends, improve the overall shipping & freighting accuracy, and ultimately, helps your business grow.
- Freight cost per unit
Freight cost per unit, one of the essential supply chain KPIs for any scaling company, provides you with a solid insight into how economically you can ship your products. Any too long or poorly structured process will lose you time, money, and client loyalty. This KPI will assist you in avoiding such issues.
- Delivered on time and in full (OTIF)
As one of the most insightful supply chain efficiencies KPI, OTIF ensures that the orders are fulfilled fully and on scheduled time. Based on whether the right product was delivered to the agreed quality standards, fulfilled in the right quantities, and returned to the agreed destination. This KPI helps in optimizing the performance consistently.
- Delivery Time
This KPI focuses on improving service: It calculates the time it takes from when an order is dispatched to when it arrives at the customer’s door. This KPI creates more precision in informing clients when the goods or products will be delivered.
- Use of packing material
This scannable supply chain KPI helps track the number of packing materials, and also inefficient packing processes cause unnecessary waste for every line of pick & pack process.
- Productivity
This KPI assesses the efficiency of a company’s machines, departments, and employees. Businesses can ensure they can deliver the products or services they offer by measuring and understanding productivity KPI.
- Return Reason
The supply chain for return reasons KPI provides valuable insight into why customers or clients return their orders. It provides critical information for the long-term profitability of an eCommerce firm.
Inventory management KPIs
To check the effectiveness of Inventory management the following KPIs are used:
- Customer Backorder Rate
Backorders are orders that cannot be filled when a customer places them. This metric directly contributes to customer satisfaction. A high backorder rate means your customers will have to wait as you try to satisfy their orders, which will have a long-term negative impact on customer happiness and retention.
- Inventory To Sales Ratio
The Inventory to sales ratio KPI measures the Inventory in stock versus the number of fulfilled sales, as Inventory is often a company’s most significant expense. These businesses can keep their inventory expenses low relative to their overall sales and save money.
- Accuracy of Forecast Demand
Accuracy of forecast demand or demand forecast accuracy measures the percentage that indicates how well the actual on-hand quantity matches the forecast. It also examines what a business predicted, ordered, and sold in the previous period.
- Rate of Return
The return on investment (ROI) or Rate of Return (ROR) is a percentage that illustrates the profit on investment over the period. This percentage is usually expressed as a percentage of the original investment over a year.
- Product Sales
Product sales, also known as sales revenue KPI, measures income generated from customer purchases minus any returns or canceled sales. This metric is generally reported for a standard time period, such as a month or year.
- Revenue per Unit
Revenue per unit measures how much one unit of product is worth. This metric is mainly helpful for subscription-based businesses.
- Cost per Unit
The cost per unit (CPU) is a measurement of how much it costs a company to produce or buy a single product unit. It works best in businesses that produce or sell big quantities of the same product.
- Gross Margin by Product
Gross margin by product measures the amount of money a company keeps per dollar of sales. This metric removes any costs from producing the item.
- Gross Margin Return on Investment
Gross margin return on investment (GMROI) displays how much a company/business made compared to investing in stock purchases. This number determines how well a company purchases and sells its goods.
- Put Away Time
Put away time measures the time it takes for a company to stow/store inventory. Chronologically, the actions that determine put away time follow those that choose time to receive. Lead time is reduced when this metric improves inefficiency.
- Time to Receive
Time to receive measures the rate at which staff bring in and prepare to sell new stock. This KPI measures the efficiency of a company’s stock receiving process.
- Supplier Quality Index
The supplier quality index (SQI) measures a vendor’s performance in crucial areas such as material quality, corrective actions, rapid response, delivery quality, quality processes, and commercial posture. This is the broadest metric that businesses can use to evaluate their vendors.
- Inventory Shrinkage
Inventory shrinkage refers to the amount of Inventory a company should have on hand but cannot account for. The company displays the list of those products for sale, but either doesn’t have or cannot sell them. Shrinkage usually results from theft, damage, miscounts, or fraud.
- Inventory Carrying Cost
Inventory carrying cost, also known as holding costs or the cost of carrying Inventory, measures the percentage of the total value a company pays to maintain Inventory in storage. The costs include insurance, rent, labor, warehouse, and unsellable products.
- Customer Satisfaction Score
A customer satisfaction score (CSAT) measures the level of customer happiness with the product and the company. Customers respond to a short survey by rating the product and company on a scale.
- Service Level
The service level metric addresses the percentage of customers who do not experience stockouts. This metric balances excess inventory and stockout costs resulting from too much and not enough inventory to fulfill orders.
- Lead Time
It measures the time from the moment the customer places an order to the moment it is ready for delivery.
- Dead Stock/Spoilage
Deadstock is Inventory no one wants to buy. When the company cannot sell the remaining Inventory, the stock is “dead.” The percentage of stock that is dead stock is an important metric because it indicates the company’s viability.
- Available Inventory Accuracy
Available inventory accuracy relates to the company’s stock status. This KPI displays the difference between the number of items the company claims in electronic records and what is on the shelf for sale. The physical inventory count confirms the electronic file totals. The difference can be theft, breakage, fraud, and loss.
- Internal Warehouse Management System (WMS) Efficiency
Internal warehouse management system efficiency measures the return on investment (ROI) for a company’s internal inventory management system. ROI includes profit and loss resulting from purchasing the software and any required hardware, unrecognized gains like saved data entry time, and new opportunities.
- Labour Cost per Item
Labor cost per item, also known as unit labor cost, is used to measure how much a company spends to produce one product unit. This metric includes workers’ wages and any additional costs of moving a product from production to sale.
- Labour Cost per Hour
The labor cost per hour is the hourly cost of an employee to the company. This KPI reminds businesses to use their employees’ time more efficiently.
- Days on Hand [DOH]
Days of Inventory on Hand (DOH) or days of inventory outstanding metric determines how quickly a company utilizes the average Inventory available at its disposal.
- Inventory Turnover
This KPI shows how many times the total Inventory is sold over a given time. Inventory turnover can be used to assess the efficiency of order fulfillment, marketing and sales activities, and manufacturing processes.
- Inventory Velocity
Inventory velocity KPI reveals the percentage of Inventory estimated to finish during a given period. This KPI provides valuable insights into the warehousing operations and helps optimize the inventory levels, meet customer demands effectively, and reduce risks of excess and outdated Inventory.
- Gross Inventory
Gross Inventory KPIs are similar to complete Inventory, the cost of merchandise, materials, and objects/items purchased by your company to make products for customers.
- Excess and obsolete Inventory [E&O]
Obsolete Inventory: refers to a physical inventory, which is now obsolete. It includes all raw materials, WIP that becomes unusable or broken, and unsold finished items due to less market demand.
Excess Inventory: It refers to Inventory that exceeds the projected demand due to the accurate amount, regarding raw materials and finished goods/items, being more than what is required to complete future orders.
- Inventory Days of Supply
This KPI helps in tracking the amount of Inventory in the warehouse so that you may replenish it just in time before demand spikes or in case of a stock-related catastrophe, all while protecting the reputation and investments. You can monitor and analyze this information on a day-to-day basis and take action to refill stocks promptly.
- Freight Payment Accuracy
Freight payment accuracy, also called freight bill accuracy, measures the number of error-free freight bills compared to the total number of freight bills. Freight bills are quite error-prone, yet data errors are incredibly costly.
- Pick & pack cycle time
This KPI measures the accurate gauge of how efficiently or inefficiently your entire supply chain cycle is, breaking it down into specific lines. Each metric in the KPI is intended to measure the time when an employee selects an item from the shelf and the completion of the packaging process.
As a result, you may take specific action to address these issues quickly, reducing total cycle times.
Logistic Management KPIs
To check the effectiveness of Logistic Management the following KPIs are used:
- Trailer Utilization Rate
This KPI measures how healthy companies are loading their trailers. It represents the company’s load planning and whether it reduces the costs there as much as possible. - Truck Turning
This KPI tracks when a delivery truck enters and exits a facility to collect or deliver products. The longer a truck is on the road, the lower its turning rates are. This percentage indicates how well a company handles loading and unloading. - Inventory Accuracy
This KPI is used to check inventory accuracy, determine whether items were delivered to the correct locations in the right quantities, and the overall number of counted sites. - Safety-Accidents records
Safety-Accidents records KPI is used to track the Accident records that happened in the whole supply chain process. - Safety-near Miss Reports
Safety-near Miss reports KPI is used to track the Near miss reports of each month, which makes the chain more efficient. - Warehouse cost performance
Warehouse cost performance KPI tracks the average cost per unit shipped. - Warehouse order picking
Warehouse order picking KPI is used to track orders determined per hour. - Fright transport cost USO
Fright transport cost USO KPI is used to track the Average cost per unit delivered. - Freight transport efficiency
This KPI is used to track the Vehicle fill efficiency. This measures the percentage of actual load carried against the potential capacity of the vehicle fleet (Ton or cube). - Fright transport Co2 Emission
Fright transport Co2 Emission KPI tracks the C02 produced per km. - Warehousing Costs
Warehousing costs are a group of metrics that describes the expenses associated with your warehouse. These can include any expenditures associated with getting goods into and out of the warehouse, such as equipment, energy, labor, delivery, and shipping. This KPI can be used to assess the efficiency of your warehouse operations. - Overall Transportation Costs
Transportation costs are indicators that measure an order’s price from beginning to end. Overall Transportation Costs metric includes Inventory carrying costs, order processing, administration, warehousing, and transportation costs. - Supply Chain Costs
This KPI depicts the entire supply chain’s essential performance cost, including planning, managing teams, sourcing, delivering, etc. It’s critical for any business to increase its profit, and reducing costs is one of the often-applied strategies. That way, the company can identify if there is any space for improvement without the need to increase sales in the process. - Supply Chain Costs vs. Sales
This indicator calculates the supply chain costs as a portion of sales and, in essence, it will indicate how much you are spending relative to a whole.
Benefits of Supply Chain Analytics
- They can help at every stage of the supply chain by identifying patterns and providing other helpful information.
- They can reveal the opportunities for process improvements and call attention to problems operations leaders may not have seen coming. The capacity to identify current supply chain risks and predict future ones may be an essential benefit of analytics, as supply chain disruptions can significantly impact the finances.
- Real-time analytics also aids businesses in improving profitability, avoiding stockouts, reducing late shipments, and adapting to changing client preferences. This data information helps businesses optimize their deployment of resources, leading to cost savings.
- As many organizations strive to be “data-driven,” supply chain analytics represent a critical step toward the goal. Company leaders can make better decisions when armed with detailed supply chain information and reports.
Future of Supply Chain Analytics
In recent years, supply chain analytics has become a hub of innovation. Companies recognize this is an area of their business ripe with cost-cutting and customer-experience-improving potential. Analytics will be a crucial tool in realizing many organizations’ goals for better visibility and transparency of the whole supply chain. By 2025, the global market for supply chain analytics is expected to reach $10 billion, with a cumulative annual growth rate (CAGR) of 16%.
Although prescriptive and cognitive analytics are still out of reach for some smaller businesses due to the people and capital resources needed, this is changing and will continue to improve in the near future. Leading supply chain software suppliers for developing and mid-market companies are already adopting AI into their systems to provide smaller businesses with the same benefits as larger companies.
In the years to come, supply chain analytics will pull from an even larger pool of data as companies continue to digitize their operations in factories, warehouses, trucks, and more. And to turn that ever-growing set of data into digestible insights, technology providers will leverage various technologies. It’s the only way for companies to benefit from the tremendous volume of information coming from their supply chains.
Conclusion
Supply chain analytics can help you gauge the financial health of your business. They can also reveal valuable insights about your warehouse operations, logistic management, and order management, which allow the company to make intelligent decisions.


