

More and more businesses are leveraging data to improve their customer experience. Researchers and innovators are creating new machine learning tools for all kinds of domains. One such recent advancement is the development of tools and algorithms that can work on Non-euclidean data.
Until now the majority of deep learning is applied to Euclidean representation of data. The difference between Euclidean and non-euclidean data is very well explained by the phrase mentioned in one of these StackExchange answers, in non-euclidean geometry “the shortest path between 2 points isn’t necessarily a straight line.” To elaborate more on this, euclidean space has a notion of left, right, up, and down like images, it is mostly a 1D or 2D representation of actual things. This representation of real things in lower dimensions is often lossy, for example in the case of an image the representation is restricted to a single viewing angle. Non-euclidean data can, however, represent more complex concepts like, the structure of a molecule, 3D objects, social networks, power grids, etc., non-euclidean data does not have any notion of direction, something cannot be above or below some other thing, everything is relational. When we design algorithms to handle non-euclidean data we are giving this information that the relation between two entities is meaningful and we’d like to capture patterns in these relationships.
The reason traditional deep learning algorithms like CNN do not work on non-euclidean data is the absence of direction and the fact that each entity can have direct relations with an arbitrary number of other entities. Geometric deep learning is the subfield of deep learning that deals with non-euclidean data and one important example of non-euclidean data is a graph.
In the rest of the article, I’ll try to clear up some terminologies associated with geometric deep learning and document good resources for in-depth understanding. Let us get started;
Graphs
This term has multiple meanings as per the context it is being used often it means a chart or a plot or a visualization of some sort. In our context it refers to a data structure composed of nodes(entities) that are connected with edges(relationships) and these nodes and edges can have some properties.
To really understand the importance of graphs in real-world, consider a situation; you are having a discussion with some business folks about how their solution works, in no time you’ll end up seeing bubbles and arrows scribbled down to explain how something moves from point A to point B and so on. There is very little possibility someone will write SQL queries to explain their business model. (Although that would have definitely made my life easier 😉 ). This example might seem like a case of data visualization but it is not, those bubbles and arrows will have some properties and they represent relationships between two processes.
Another example is a command-line tool(tree) which gives a well-arranged view of directories in a tree format, similar to what we see in our IDE’s, tree is a special case of the graph. From content recommendation to the understanding the spread of viruses, graphs are everywhere. Graphs played a really important role in Google becoming a verb from a noun.
This blog post discusses the representation of graphs in great detail.
Knowledge graphs
There is no one agreed-upon definition of the knowledge graph, in fact, there is a paper titled Towards a Definition of Knowledge Graphs which noted important definitions in a tabulated manner.
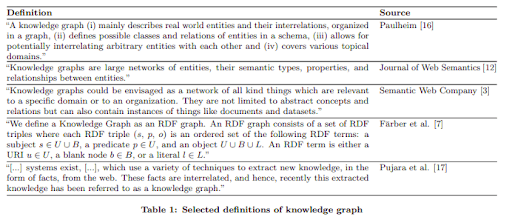
The paper then goes on to propose a definition:
A knowledge graph acquires and integrates information into an ontology and applies a reasoner to derive new knowledge.
Knowledge graphs are one of the ways to represent ontology. Usually, an ontology deals with the concepts, not the instances of these concepts, when an ontology is represented with a knowledge graph, it is possible to extend this knowledge graph with the fact that it is extracted from some source and could help in the interpretation of the given source. Knowledge graphs based databases lie somewhere in the middle of relational database and key-value DB, they don’t hold the tight structure but still contains relation between records and because it is a graph we can run graph algorithms on KG.
Wikipedia provides great tool Wikidata Query Service to query there knowledge base with SPARQL(SQL like) language.
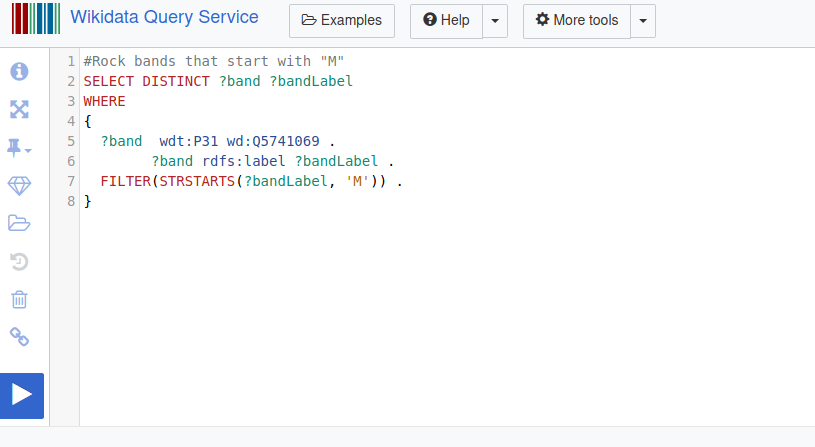
this will give a list of rock bands whose name starts with ‘M’
Graph Embedding
Embedding in general means representing high dimensional data in lower dimensions such that similar objects are close in lower dimensions and the object maintains some semantic relation. This is useful for downstream tasks like node classification, link predictions, community detection, etc., This topic and its method are covered in much more detail here.
Graph Convolution
This is another method to solve problems like node classification, link prediction. This is different from graph embedding because it doesn’t transform data to a lower dimension but utilizes the input graph itself. This and this blog posts go into a lot of details about graph convolution.
3D Modelling and Learning
This sub-field of geometric deep learning deals with an understanding of our 3D world and its representation in the datatype that is as close to reality as possible. Some important representation methods are:
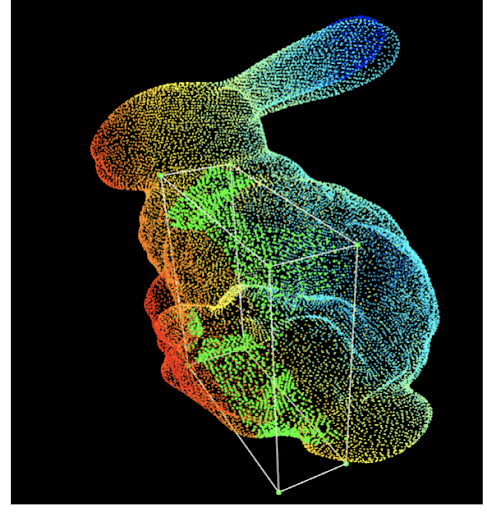
Point Cloud
A point cloud is collections of points in 3D space. These points represent the X, Y, and Z geometric coordinates of a single point on an underlying sampled surface. Point clouds are a means of collating a large number of single spatial measurements into a dataset that can then represent a whole. When color information is present, the point cloud becomes 4D. There is a point cloud library that can be used for processing
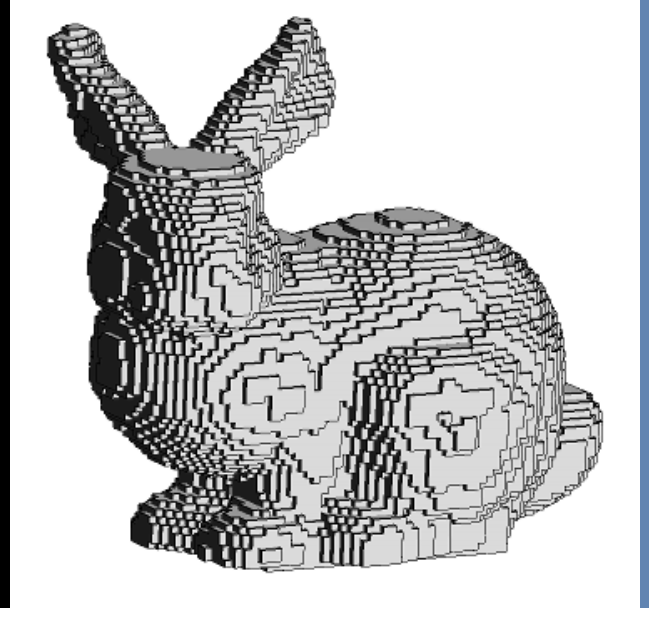
Voxel grids
These are derived from point clouds. “Voxels” are like pixels in 3D; think of voxel grids as quantized, fixed-sized point clouds. Whereas point clouds can have an infinite number of points anywhere in space with floating-point pixel coordinates, voxel grids are 3D grids in which each cell, or “voxel,” has a fixed size and discrete coordinates.
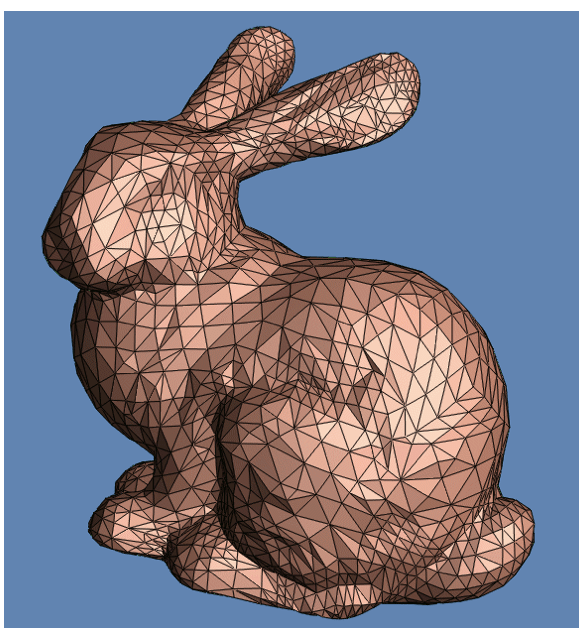
Polygon meshes
The idea behind the polygon mesh is to approximate the 3D surface of anything with lines and polygons. A polygon mesh is a collection of vertices, edges, and faces that defines the shape of a 3D object with polygonal faces, straight edges, and sharp corners.
This article goes into more details about 3D modeling and learning
Parting Note
Here I have discussed 3D modeling and Graphs as separate topics but the algorithms applied for specific tasks can be the same. With suitable data pipelines and out of the box support for multiple algorithms modern frameworks like PyTorch Geometric, StellarGraph, PyTorch Points 3D, PyTorch Geometric Temporal, etc., will tremendously accelerate the applications and research of Geometric deep learning. In the next part, I’ll try to cover code examples, specific use cases, and basic customization.
Google recently released Objectron which has annotated 3D objects and bounding boxes. Combining Geometric deep learning with Augmented reality is a growing area as well and I believe it will find tremendous use cases and objectron like datasets will help this cause. On an unrelated note check out the amazing work of Anna Zhilyaeva, she is an artist who draws in virtual reality maybe in the coming time we will be able to use GAN’s like algorithm on non-euclidean data to create similar artwork.


